ETF Comparison: EQE vs. XEU
EQE and XEU offer near-identical returns for European equity exposure, but their index methodology and cost structure diverge in ways worth understanding.

The European equities asset class gives investors access to many notable firms based in the region, many of which have a global presence. While the success and ongoing business activities of U.S. companies often make headlines, many industry-leading firms originate in Europe, each with a strong value proposition and demonstrable growth over time that has benefited investors.
ETF Comparison: EQE vs. XEU
For Canadian investors interested in European equities, the CI S&P Europe 350 Equal Weight Index ETF (Tickers: EQE/EQE.F) and iShares MSCI Europe IMI Index ETF (Tickers: XEU/XEH) are two solutions that provide exposure to the asset class. Please note that EQE.F and XEH are the currency-hedged versions of the respective ETFs. Using Cboe Canada’s ETF Market comparison tool, investors can gain both qualitative and quantitative insights into how the funds differ.
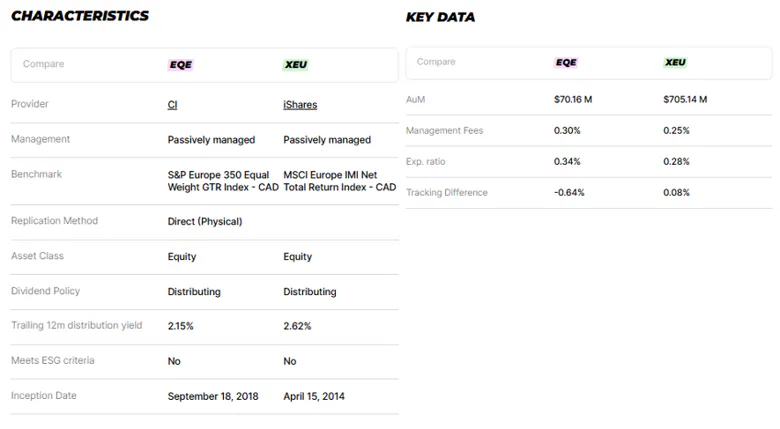
While both ETFs are passively managed and share a regional focus, their underlying benchmarks differ. EQE seeks to replicate the S&P Europe 350 Equal Weight Index, which has the same constituents as the capitalization-weighted S&P Europe 350 Index. Conversely, XEU replicates the performance of the MSCI Europe Investable Market Index. As such, the index providers differ, and the market capitalization weighting also differs (i.e., Equal-Weight vs. Market-Weight). Other differentiating attributes include XEU’s larger Assets under Management and lower price point (i.e., Management Fee and Management Expense Ratio).
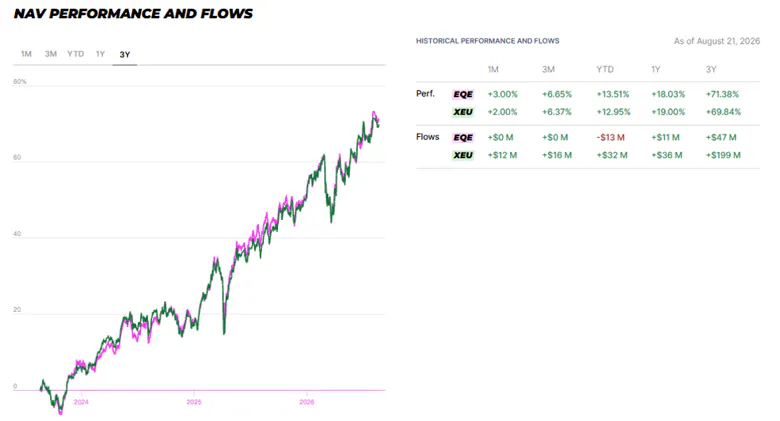
From a performance perspective, as shown in the growth chart, both funds exhibit a similar return profile. However, in reviewing trailing performance, EQE’s slight outperformance is evident. In looking at the composition of both funds, based on their respective product pages (i.e., EQE vs. XEU), there are near-similar topline geographic and sector allocations; the former being the United Kingdom (EQE: 23.22% vs. XEU: 22.29%) and the latter being the financial sector (EQE: 21.95% vs. XEU: 26.82%). The remaining geographic and sector allocations of the funds differ considerably.
Takeaway
Given the closeness in trailing performance, cost becomes a more meaningful differentiator between the two. Investors prioritising a lower fee and larger asset base may lean toward XEU, while those preferring equal-weight diversification and EQE's modest performance edge may find that trade-off worthwhile.
This article was written on August 25th, 2026. Please note that this article is for information purposes only and does not in any way constitute investment advice. It is essential that you seek advice from a registered financial professional prior to making any investment decision.