
ETF Comparison: FLJA vs. ZJPN
A side-by-side comparison of two Canadian Japan equity ETFs, Franklin's FLJA and BMO's ZJPN, where a lower fee sets FLJA apart.

Year to date, the performance of Japanese equities has been noteworthy, given the backdrop of market uncertainty that has shaped the investment landscape throughout the first half of 2026. With Japan’s new Prime Minister, Sanae Takaichi, assuming full leadership in February 2026, she has sought to improve the nation’s economic viability by pursuing growth investments, ranging from increasing defence spending to bolstering Artificial Intelligence (AI) focused initiatives through government subsidies and direct investments. For investors looking beyond North America, Japan is a region of interest, given recent economic reforms and the potential for renewed growth.
ETF Comparison: FLJA vs. ZJPN
For Canadian investors seeking exposure to Japanese equities, the Franklin FTSE Japan Index ETF (Ticker: FLJA) and the BMO Japan Index ETF (Ticker: ZJPN) are ETF solutions that provide comprehensive exposure to this asset class. However, while similar in focus, the solutions differ in seminal ways. Using Cboe Canada’s ETF Market comparison tool, investors can gain both qualitative and quantitative insights into how the funds differ.
Looking at the qualitative aspects of each solution, as provided by the ETF Market Comparison tool, both ETFs are passively managed, with FLJA benchmarked to the FTSE Japan Index NTR – CAD and ZJPN to the Solactive GBS Japan Large & Mid Cap Index. Given the importance of index methodology and coverage, it is worth noting that the FTSE Japan Index is part of the FTSE Global Equity Index Series, which covers 98% of the world’s investable market capitalization. Conversely, the Solactive GBS Japan Large & Mid Cap CAD Index NTR is part of the Solactive Global Benchmark Series, which includes benchmark indices for developed and emerging market countries. The index is designed to track the performance of the large- and mid-cap segment, covering approximately the largest 85% of the free-float market capitalization in the Japanese market.
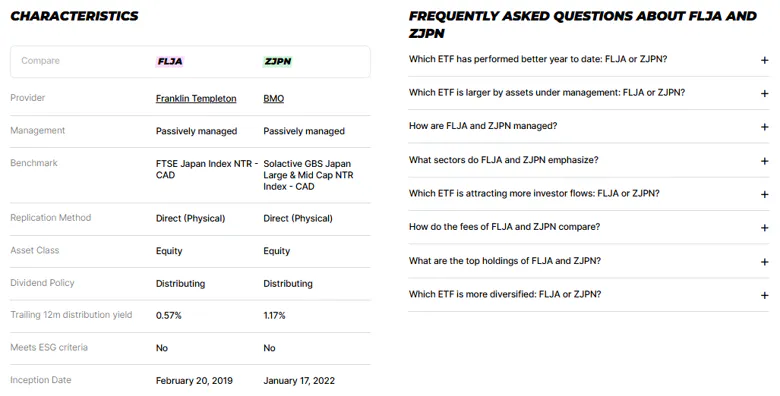
Furthering the benchmark comparison, the tracking difference from the ETF comparison tool provides insight into each solution’s performance relative to the benchmark. As shown below, FLJA has a negative tracking difference, whereas ZJPN’s is positive. A positive tracking difference means the ETF outperformed its index, while a negative value indicates underperformance. It should be noted that several factors affect how well an ETF reflects the returns of its underlying index. Finally, the most seminal qualitative difference is the fee for each solution, with FLJA’s at 0.09% versus ZJPN’s at 0.35%.
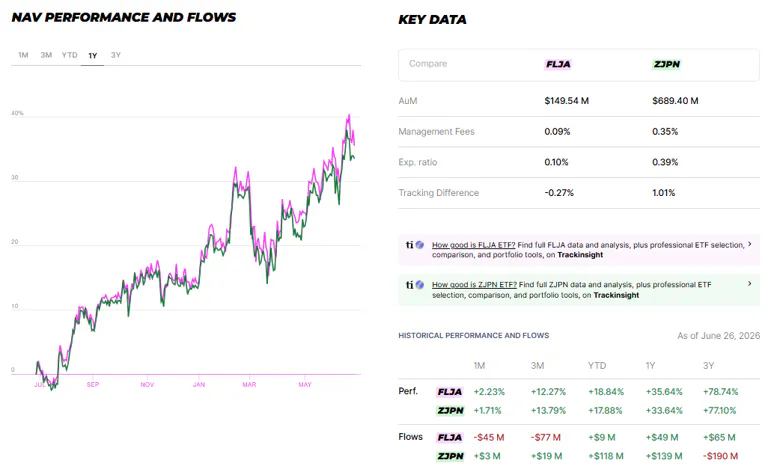
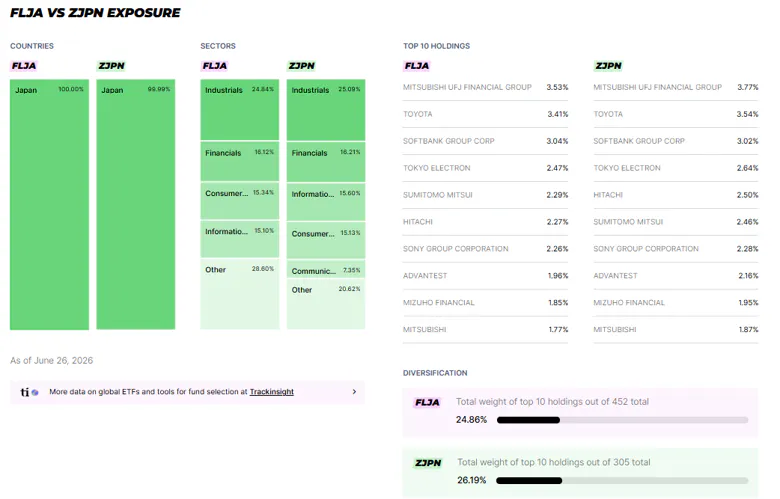
Regarding performance, FLJA has demonstrated slightly better trailing performance than ZJPN. In looking at the underlying exposure and composition of both solutions, they are very similar.
Takeaway
While both funds share the same objective, FLJA has exhibited better performance and has a lower management fee. For Canadian investors seeking exposure to Japanese equities, these solutions offer turnkey access, but FLJA’s fee is a key differentiator.
This article was written on June 28th, 2026. Please note this article is for information purposes only and does not in any way constitute investment advice. It is essential that you seek advice from a registered financial professional prior to making any investment decision.


