Canadian ETF Comparison Series: CIF vs. ZGI
Here’s a comparison of two popular Canada-listed global infrastructure ETFs.

Infrastructure has emerged as a dynamic and evolving asset class, gaining increased attention from investors. Its attractiveness stems from its stable, long-term returns. The asset class includes essential services like transportation, energy, and telecommunications, all critical to economic growth. As global urbanization accelerates, demand for new infrastructure projects is surging, resulting in greater investment opportunities and increased investor interest.
For investors looking to gain exposure to global infrastructure opportunities, the iShares Global Infrastructure Index ETF (Ticker: CIF) and BMO Global Infrastructure Index ETF (Ticker: ZGI), boasting AUMs of $470.2 million and $663.5 million, respectively, as of September 9th, 2024.
CIF vs. ZGI ETFs: How Do They Work
Both CIF and ZGI are passively managed strategies, replicating the performance of the Manulife Investment Management Global Infrastructure Index and Dow Jones Brookfield Global Infrastructure North American Listed Index, respectively. As outlined in the iShares ETF prospectus, the Manulife Index employs a proprietary quantitative bottom-up, multi-factor selection process to create a portfolio of top companies involved in the infrastructure sector.
In contrast, the Dow Jones Index reflects the performance of companies worldwide that own and operate pure-play infrastructure assets. Inclusion in the index requires securities to have a minimum float-adjusted market capitalization of US$ 500 million and that more than 70% of estimated cash flows be derived from pure-play infrastructure assets.
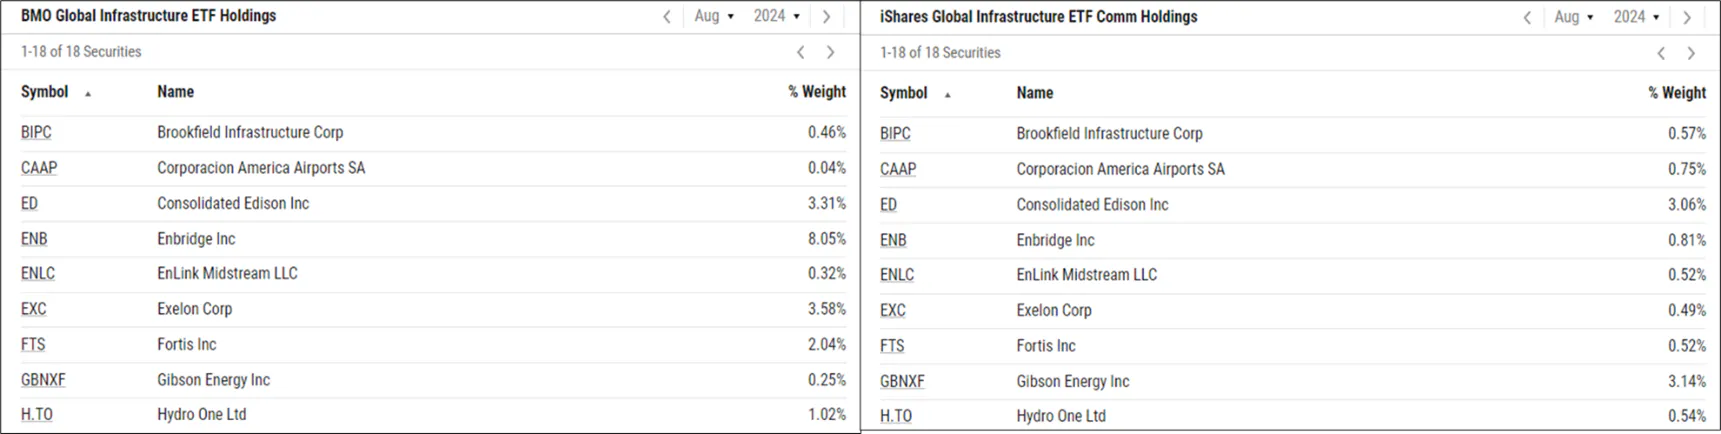
When looking at the August 2024 holdings list for each ETF, 18 common holdings were found among the funds. However, given the similar nature of both funds and their passive investment strategies, such a high number of common holdings is to be expected. In total, ZGI had 53 holdings, while CIF had 63 holdings. Below is a sample of some of the share securities held between both funds.
CIF vs. ZGI ETFs: Performance Comparison
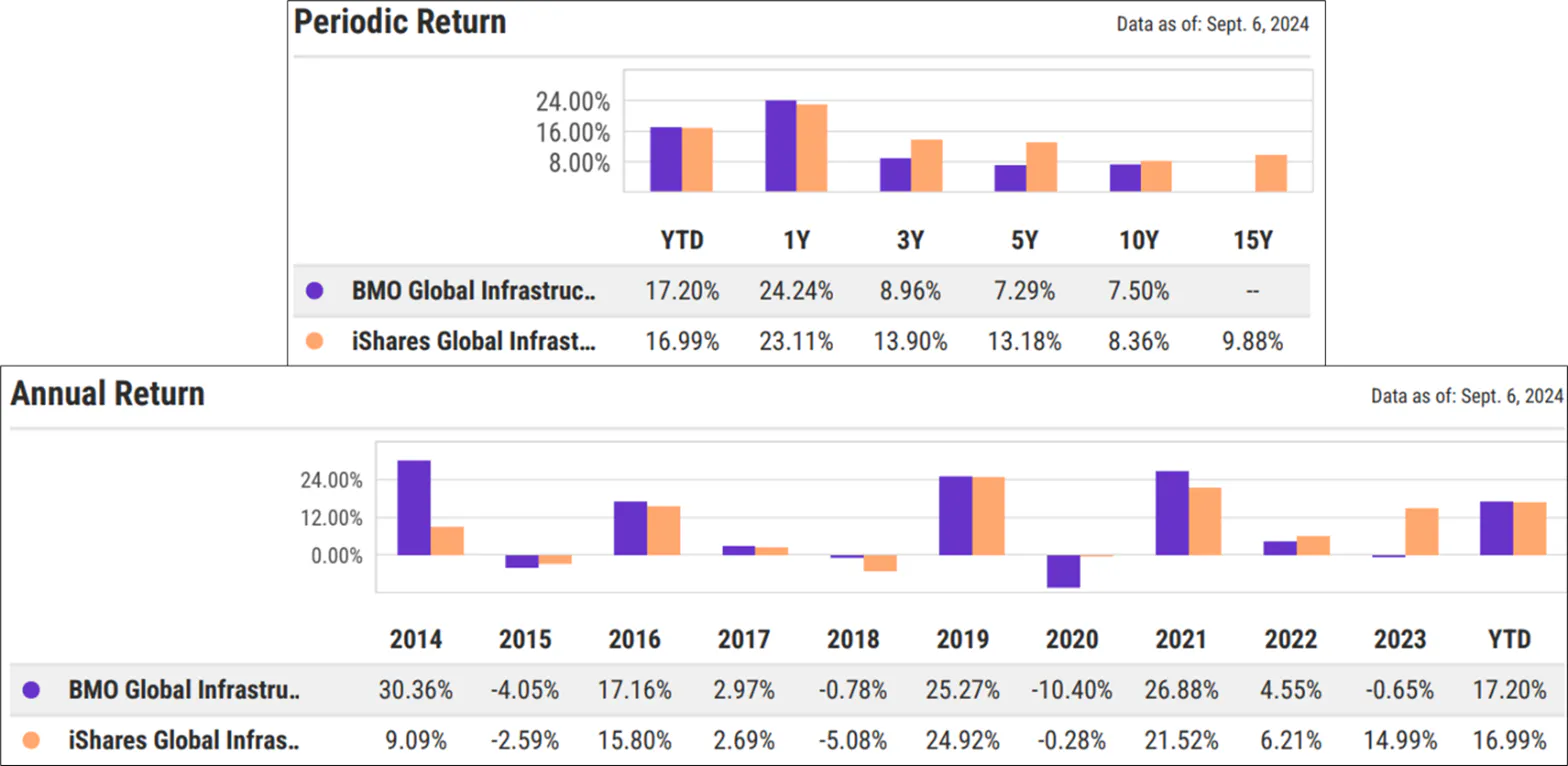
The performance of both funds has been relatively similar on a year-to-date and 1-year trailing basis. However, the differences become more evident when looking at extended periods. As illustrated in the long-term performance of both solutions, CIF has exhibited strong period returns. On an annual performance basis, CIF has demonstrated a strong performance of the decade captured.
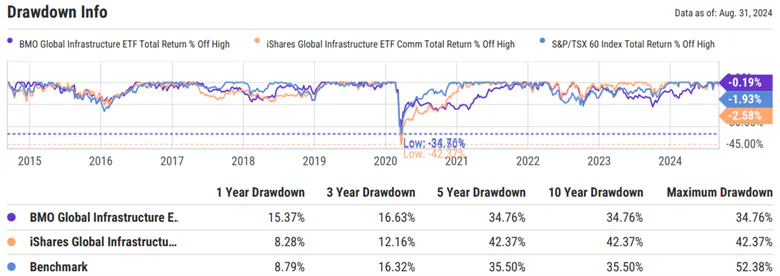
Looking at the historical drawdown of both ETFs, CIF's investment experience in recent years has been comparatively better than ZGI's, particularly over the recent 1-year time frame.
CIF vs. ZGI ETFs: Other Considerations
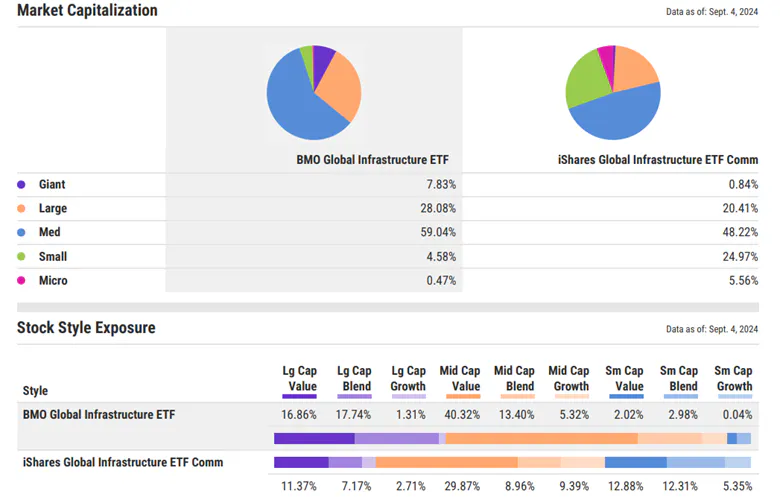
In looking at the underlying composition of both funds, CIF's holdings are more dispersed across the market capitalization spectrum than ZIF. As illustrated in the chart below, CIF's stock exposure is seemingly more varied than ZIF's, which would be a contributing factor to the fund's topline performance.
Finally, their associated fees are an important determining factor in contrasting both solutions. ZGI's expense ratio (0.61%) is lower than CIF's expense ratio of 0.72%. ZGI's tracking difference in relation to its benchmark is 0.44%. There was no readily available tracking difference number for CIF.
Takeaway
Though the recent performance of both funds is similar, CIF's long-term performance track record is a differentiator. The ETF's recent (i.e., 1-year and 3-year) drawdown performance is also a distinguishing attribute, which is completed by the fund's innate diversification, as evidenced by its market capitalization and stock style dispersion.
Please note this article is for information purposes only and does not in any way constitute investment advice. It is essential that you seek advice from a registered financial professional prior to making any investment decision.