Canadian ETF Comparison Series: FSF vs. HFG
As interest rates decline globally, explore how FSF and HFG ETFs offer seamless exposure to the world’s largest financial institutions.

The changing economic landscape will impact the financial sector, with most developed economies moving toward a reduced interest rate environment. For investors with a global focus on the financial industry, the CI Global Financial Sector ETF (Ticker: FSF) and Hamilton Global Financials ETF (Ticker: HFG) provide turnkey global exposure to the largest financial institutions.
As of September 27, 2024, the assets under management for the CI Global Financial Sector ETF and Hamilton Global Financials ETF are $443.61 million and $49.42 million.
FSF vs. HFG: Investment Strategy Comparison
FSF and HFG are actively managed solutions investing in the global financial services landscape, providing exposure to banking, insurance, payments, brokerage, wealth management, and related industries. Though both FSF and HFG have a primary geographic focus on developed economies, FSF can invest in emerging market economies.
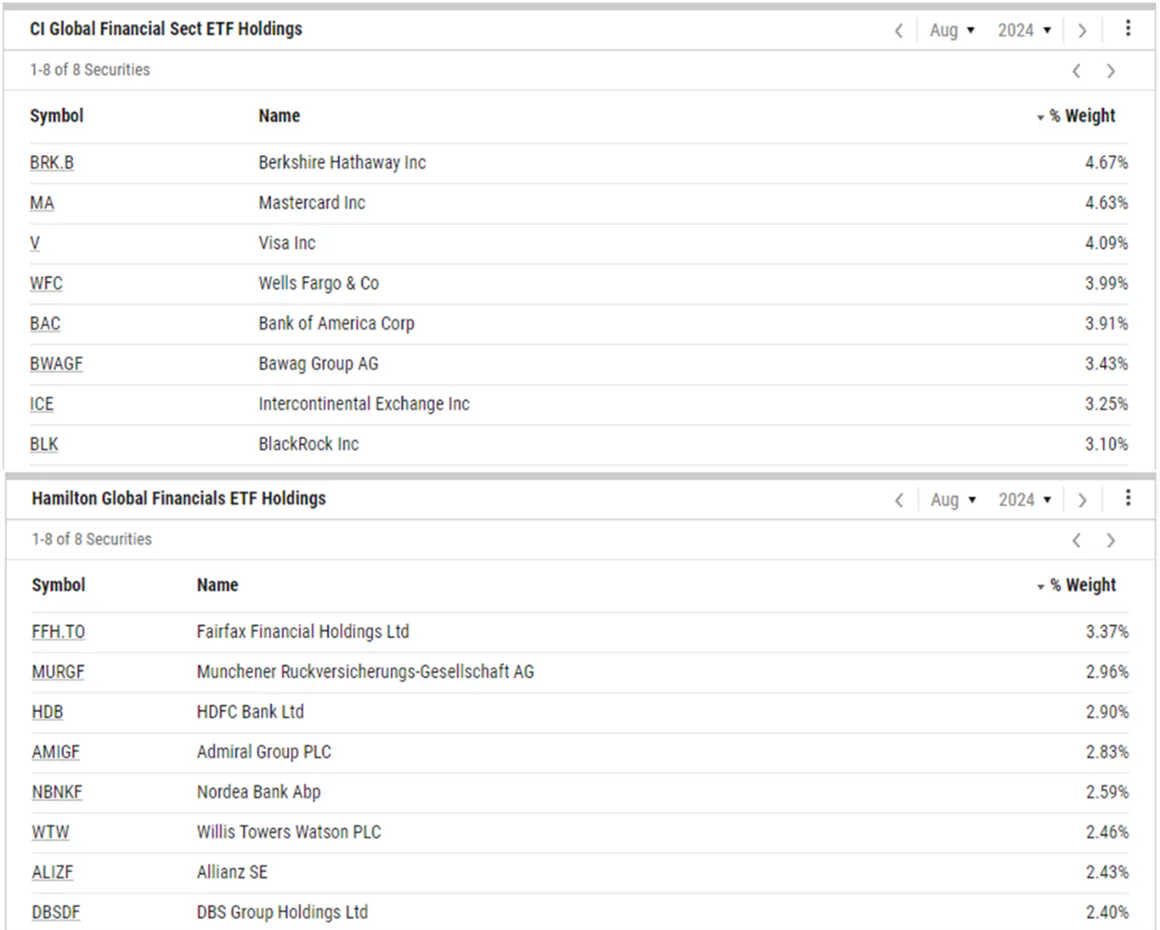
As of August 31, 2024, the number of holdings within each fund is relatively similar: FSF has 60, and HFG has 65. In conducting a holdings comparison between both solutions as of August 2024, there are at least eight unique holdings.
FSF vs. HFG: Performance Comparison
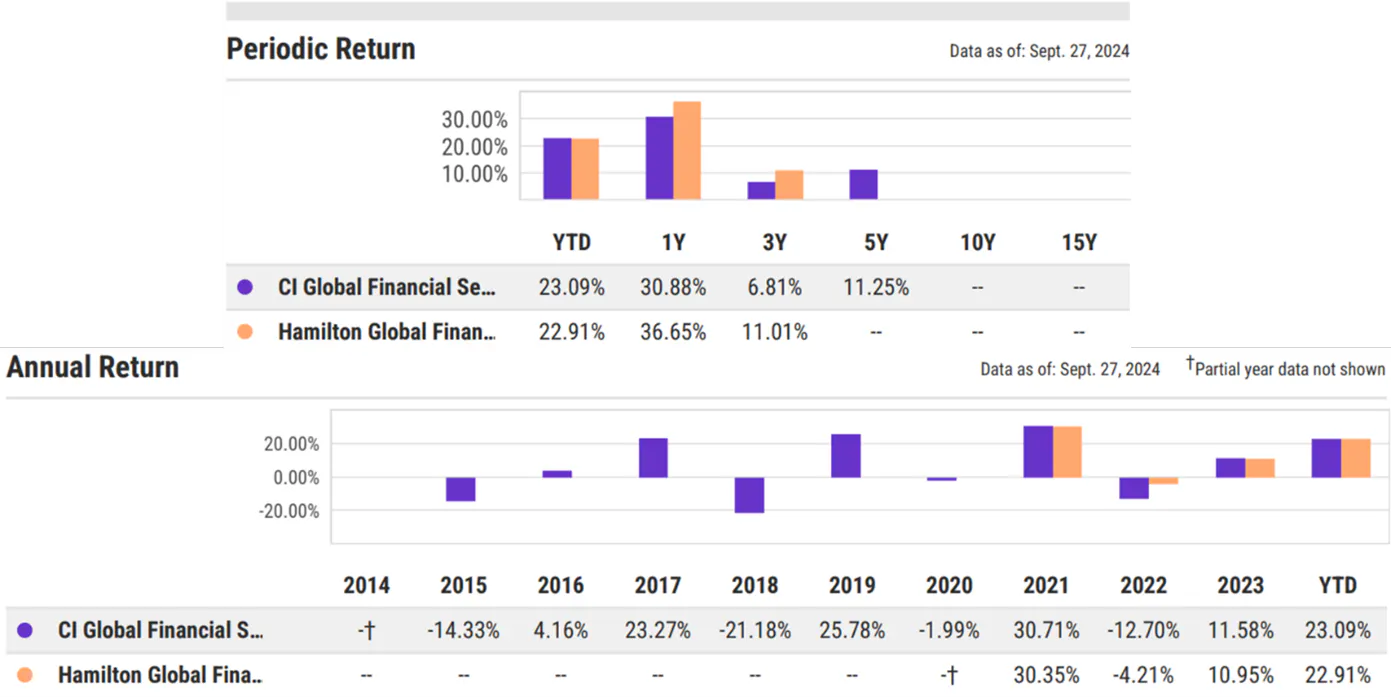
The performance of both investment solutions has been relatively similar year-to-date; however, the difference in performance becomes more evident when looking at extended periods. As illustrated in the long-term performance of both solutions, HFG has exhibited more robust periodic returns relative to FSF – for the periods with standard performance. On an annual performance basis, while FSF does have a longer track record, over the last three years, HFG has kept pace, if not outperforming (i.e., losing less) FSF.
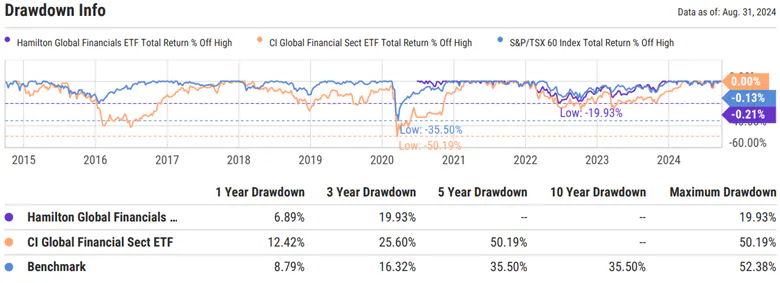
Looking at the historical drawdown of both ETFs, HFG’s investment experience in recent years has been comparatively better than FSF’s, particularly over the recent 1-year time frame.
FSF vs. HFG: Other Considerations
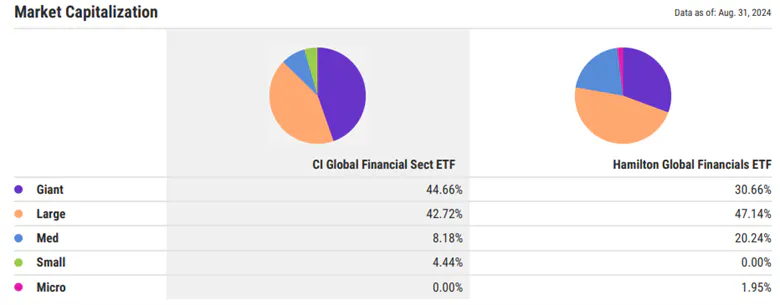
In looking at the underlying composition of both funds, HFG’s holdings are more dispersed across the market capitalization spectrum than FSF’s. As illustrated in the chart below, HFG’s stock exposure is seemingly more varied than FSF’s, which would be a contributing factor to the fund’s topline performance.
Finally, their associated fees are an important factor in contrasting both solutions. HFG’s expense ratio (0.91%) is lower than FSF’s expense ratio of 1.02%.
Takeaway
Though the recent performance of both funds is similar, HFG’s recent performance makes it a compelling choice. The ETF’s recent 1-year and 3-year drawdown performance is also a distinguishing attribute, which is complemented by the fund’s innate diversification, as evidenced by its market capitalization dispersion.
Please note this article is for information purposes only and does not in any way constitute investment advice. It is essential that you seek advice from a registered financial professional prior to making any investment decision.