Canadian ETF Flows & Market Action | October 12-16, 2026
A recap of Canadian ETF flows, performance and market activity for October 12-16, 2026.

According to data by Trackinsight, Canadian-listed ETFs recorded net inflows across all major asset classes during the week ending October 16. Equity ETFs led with C$2.18 billion, followed by Fixed Income ETFs with C$1.32 billion.
Multi-Asset ETFs attracted C$256.1 million, while Commodity products gathered C$38.7 million. Currency ETFs added C$6.1 million, and Cryptocurrency products recorded C$5.9 million in net inflows.
Materials and Communication Services Lead Sector Inflows
Materials led sector ETF inflows with C$26.4 million, followed by Communication Services at C$17.8 million and Real Estate at C$14.1 million. Financials gathered another C$5.3 million.
Energy recorded the largest sector outflow at C$89.6 million, followed by Utilities with C$53.4 million in withdrawals. Industrials lost C$5.9 million, while Consumer Staples recorded outflows of C$1.7 million.
Canadian Equity ETFs Attract C$656.8 Million
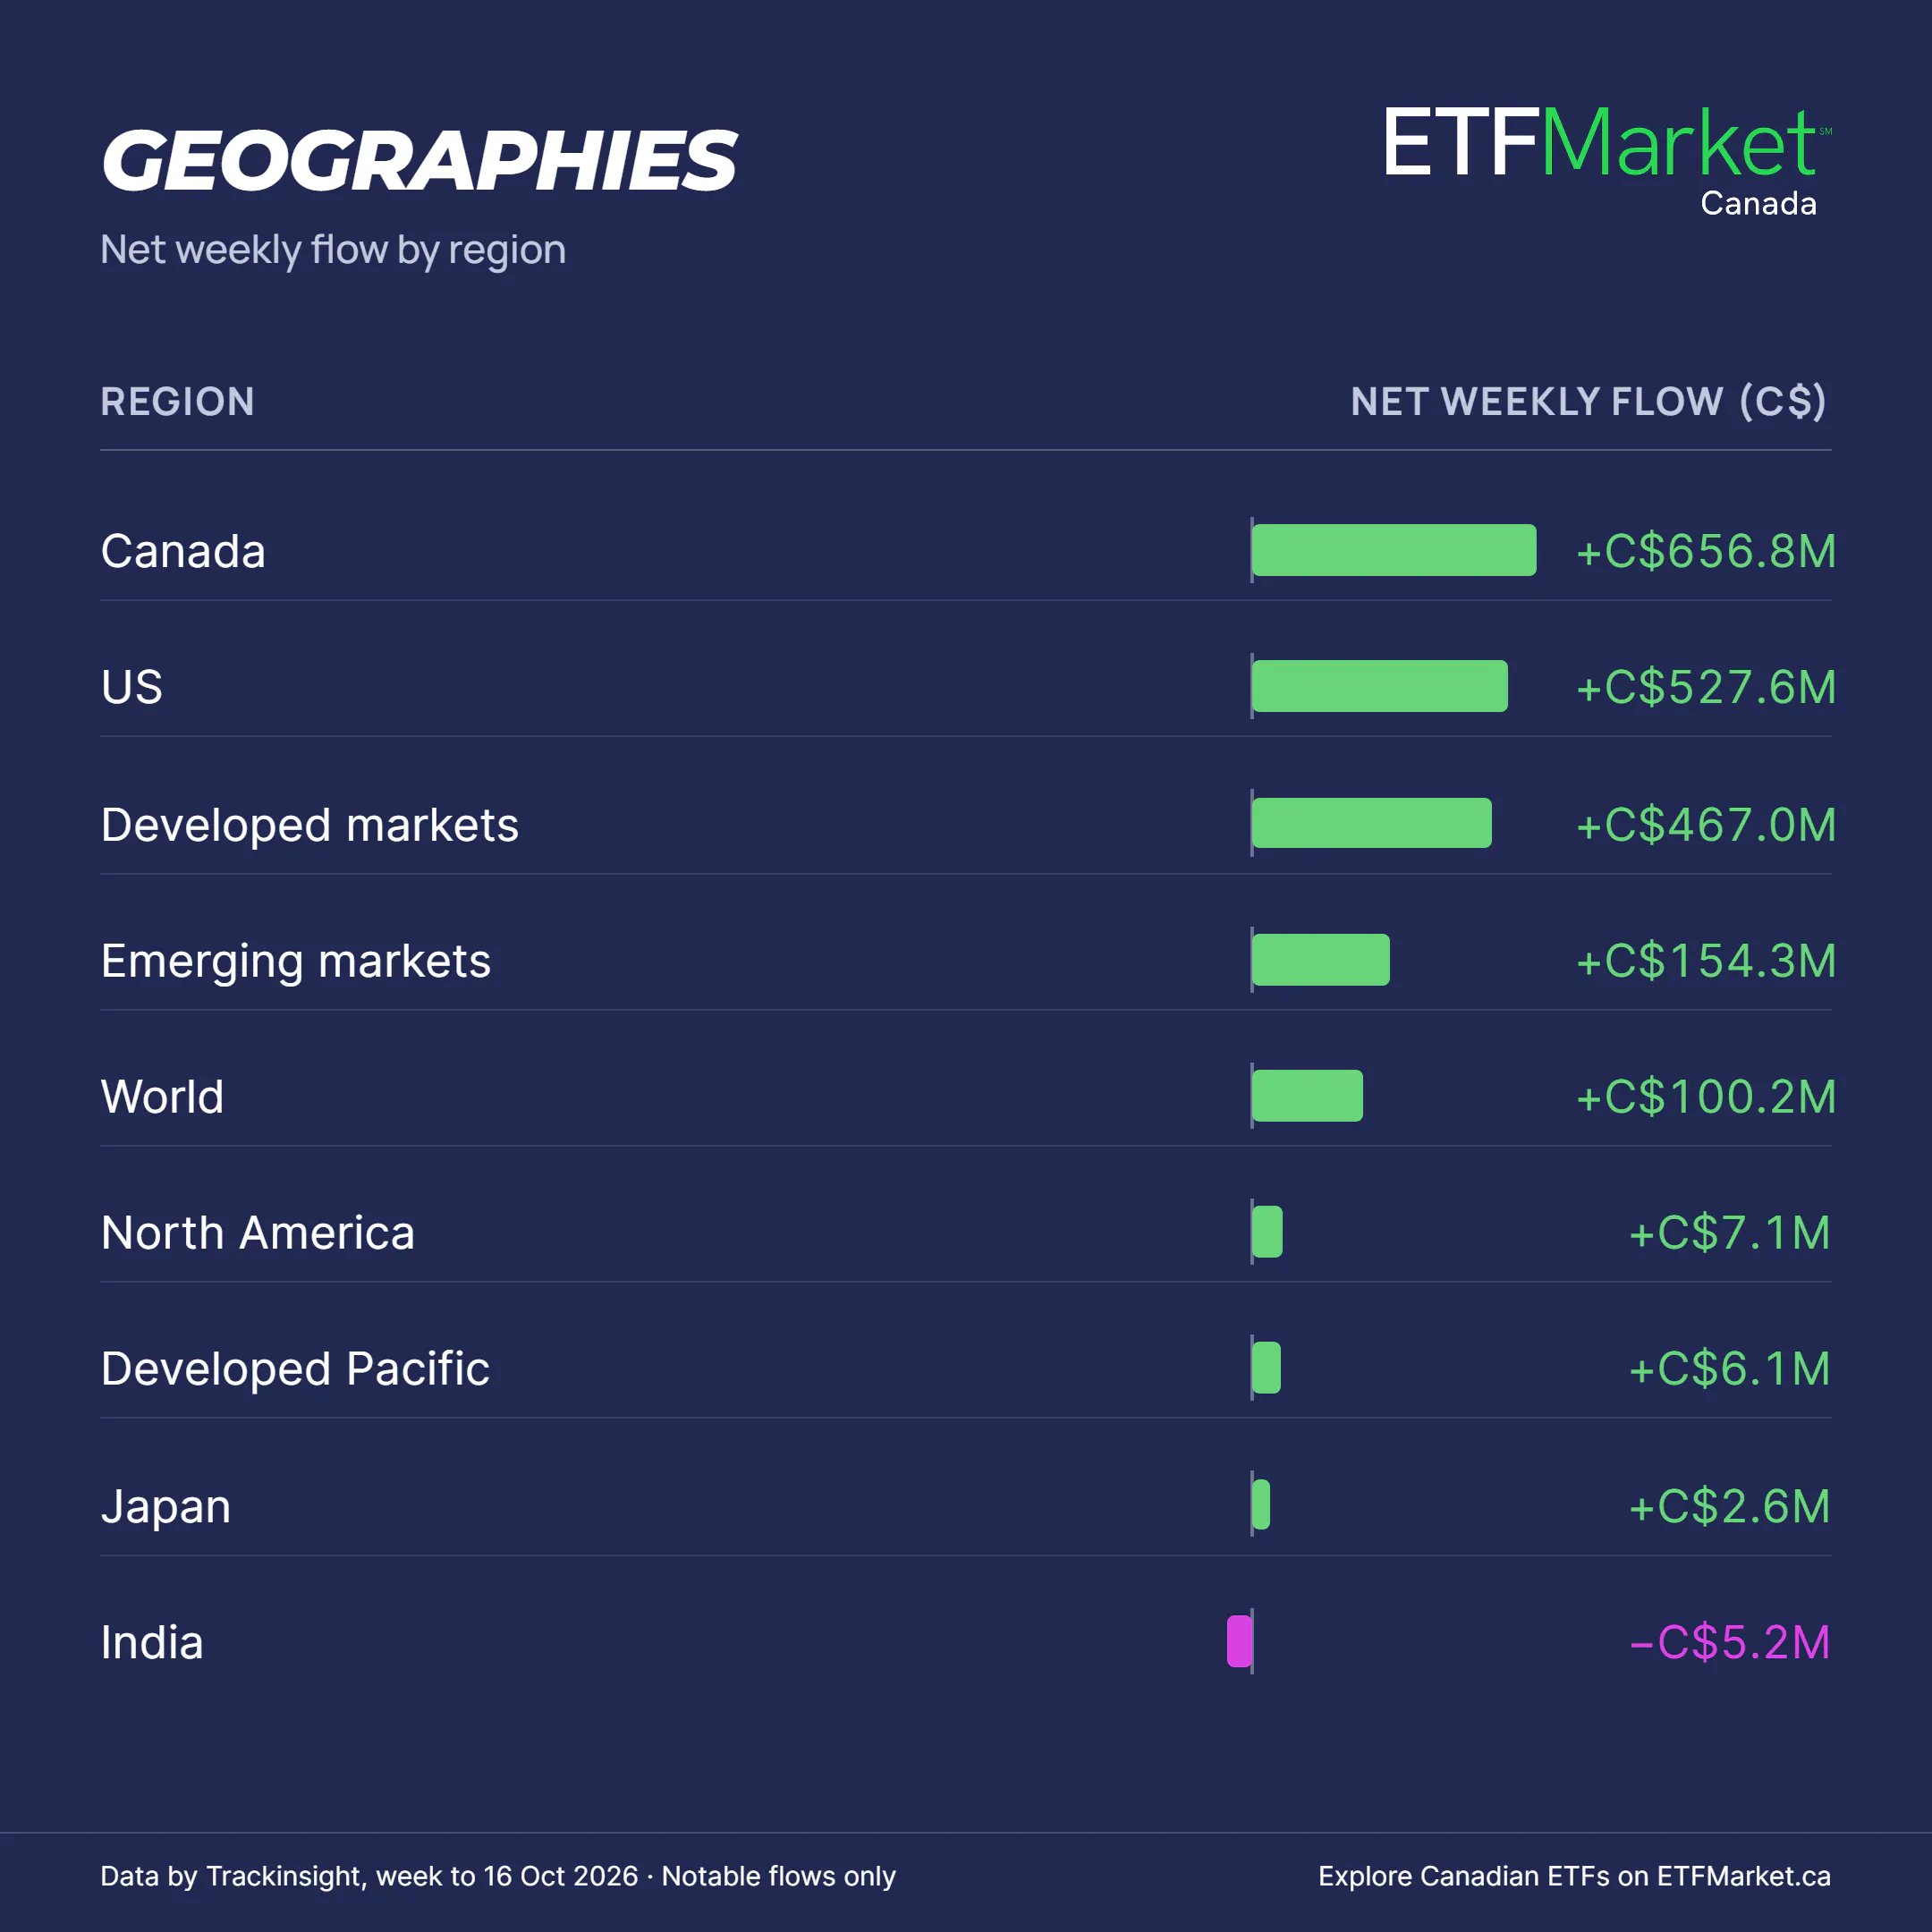
Canada-focused equity ETFs led geographic inflows with C$656.8 million, followed by U.S.-focused products at C$527.6 million and Developed Markets at C$467.0 million.
Emerging Markets ETFs attracted C$154.3 million, while World ETFs gathered C$100.2 million. North America added C$7.1 million, followed by Developed Pacific at C$6.1 million.
India recorded the largest geographic outflow at C$5.2 million, followed by China at C$1.1 million and Greater China at C$321.3 thousand.
Disruptive Technology Tops Thematic Flows
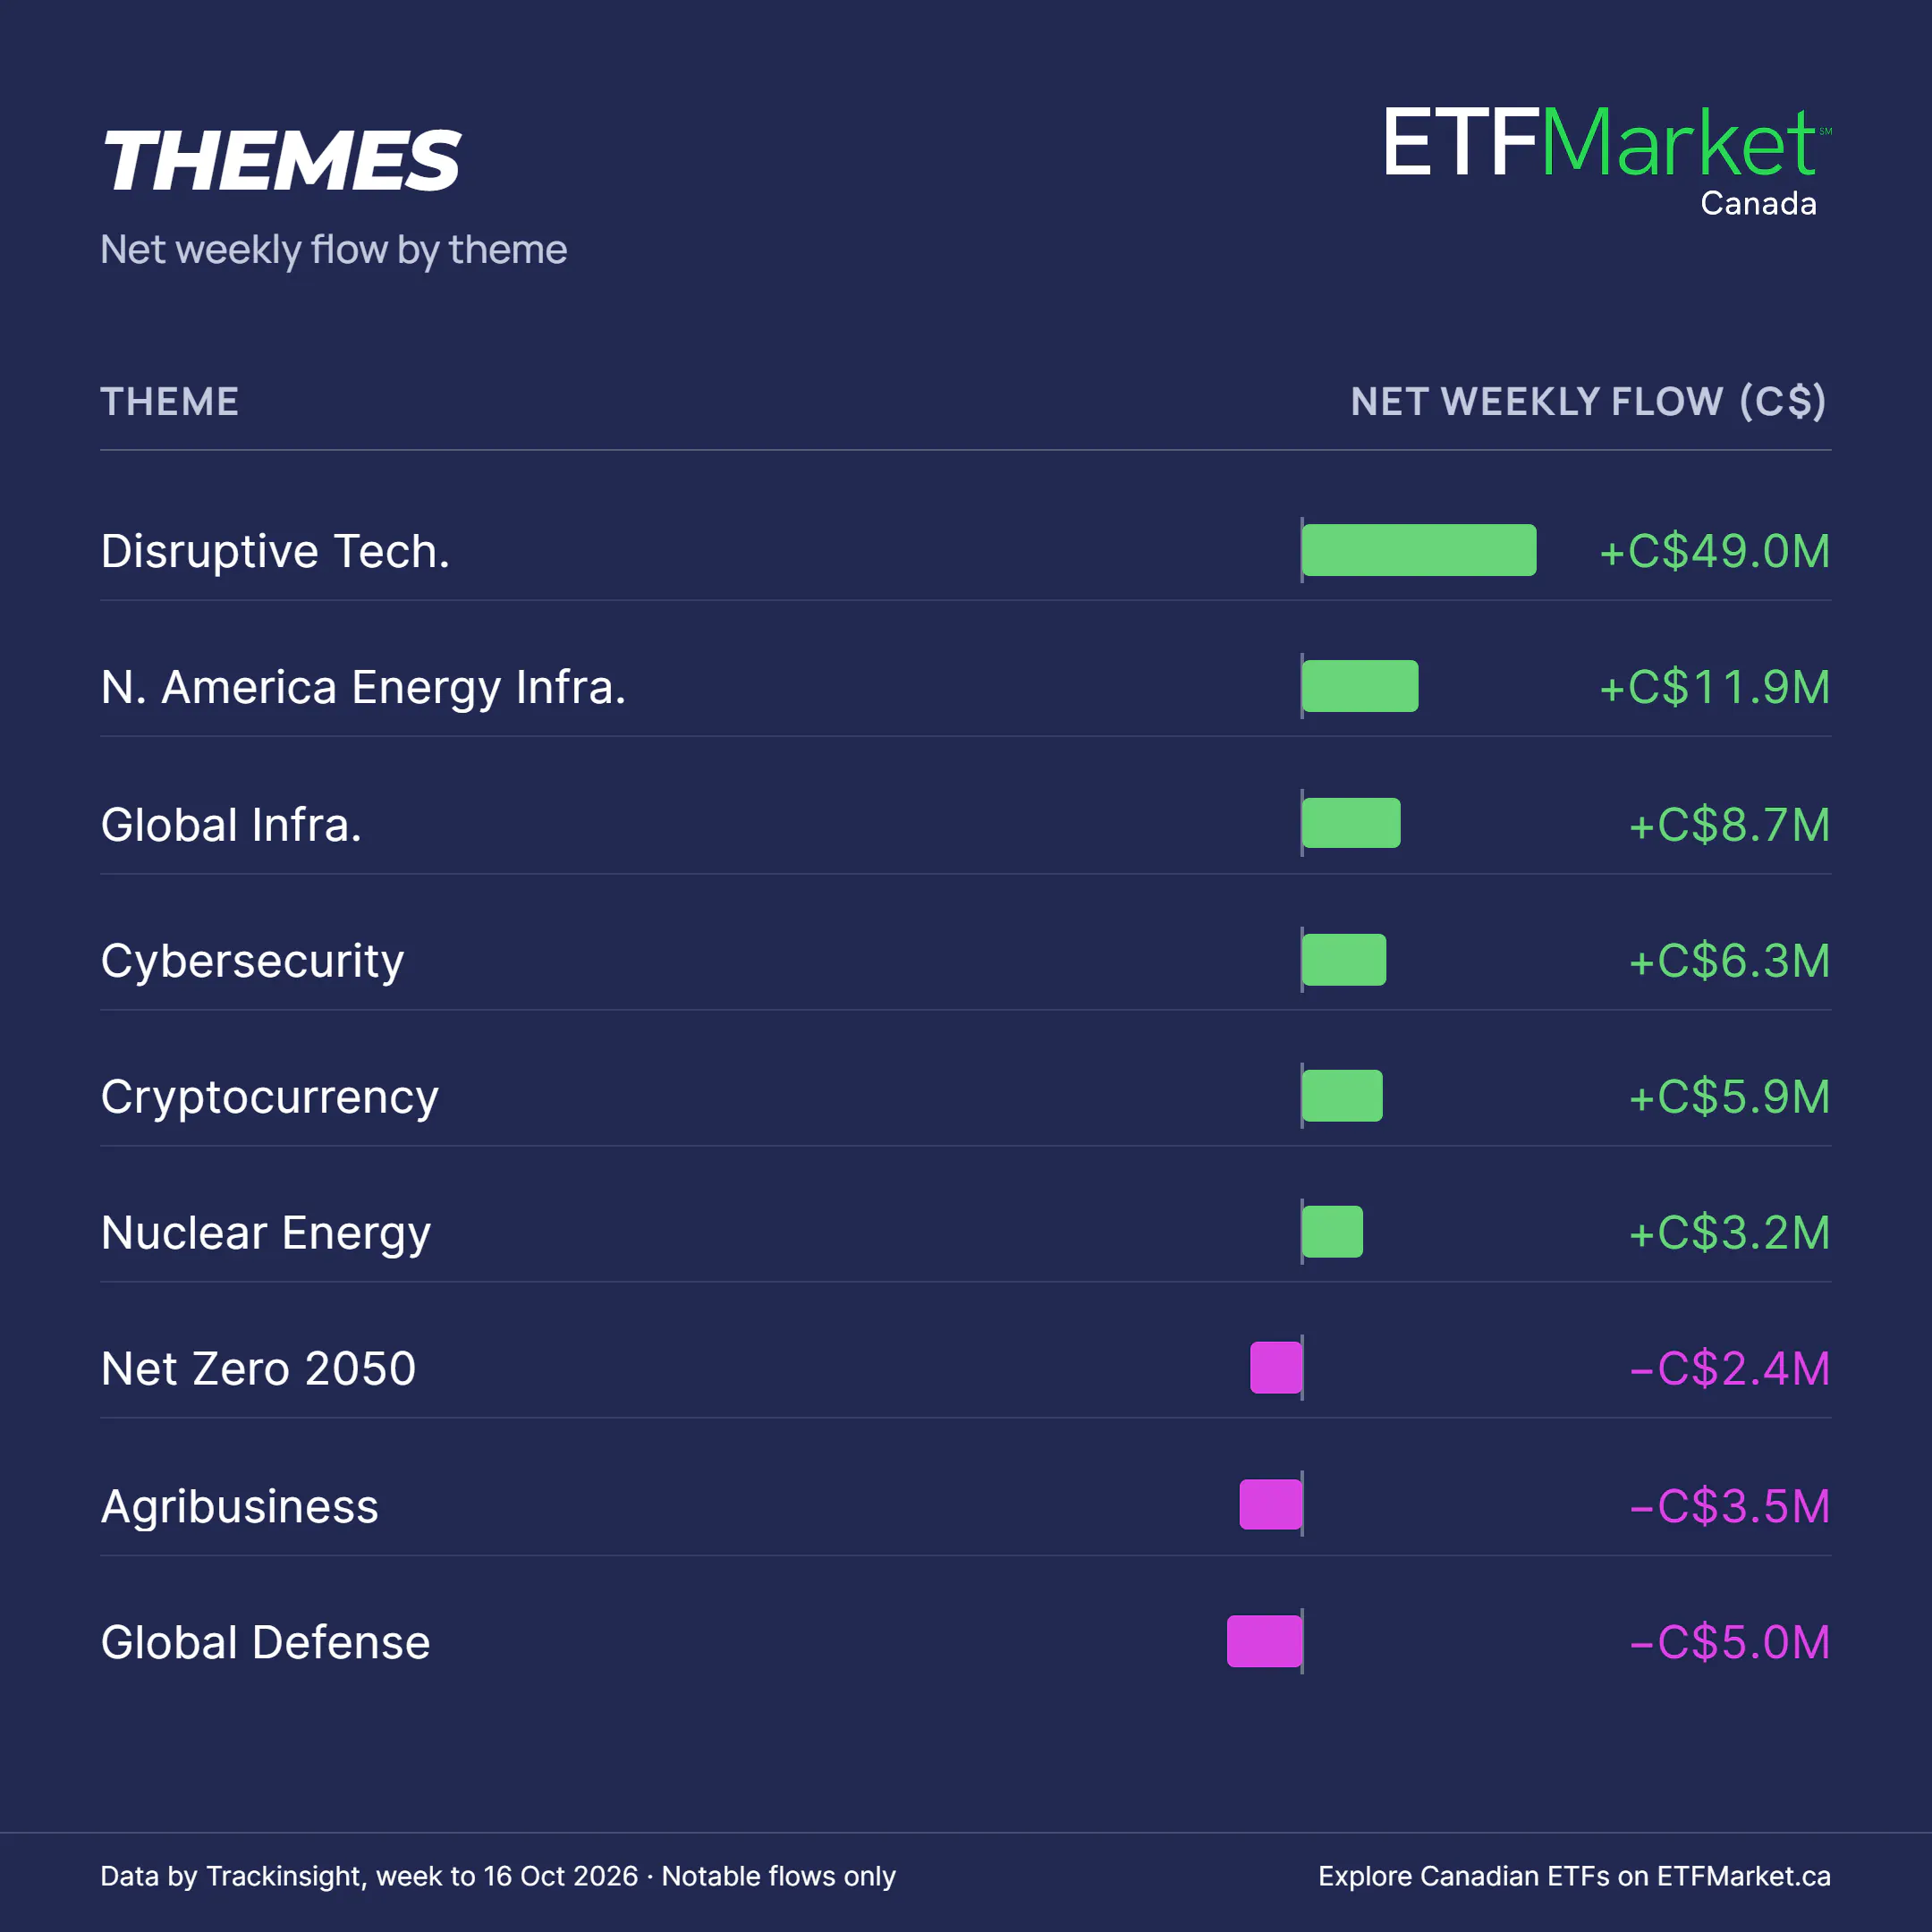
Disruptive Technology led thematic ETF inflows with C$49.0 million, followed by North America Energy Infrastructure at C$11.9 million and Global Infrastructure at C$8.7 million.
Cybersecurity attracted C$6.3 million, while Cryptocurrency products gathered C$5.9 million. Nuclear Energy added C$3.2 million.
Global Defense recorded the largest thematic outflow at C$5.0 million, followed by Agribusiness at C$3.5 million and Net Zero 2050 at C$2.4 million. Artificial Intelligence & Big Data lost C$2.0 million, while Water ETFs recorded C$1.7 million in withdrawals.
Gold Leads Commodity Inflows
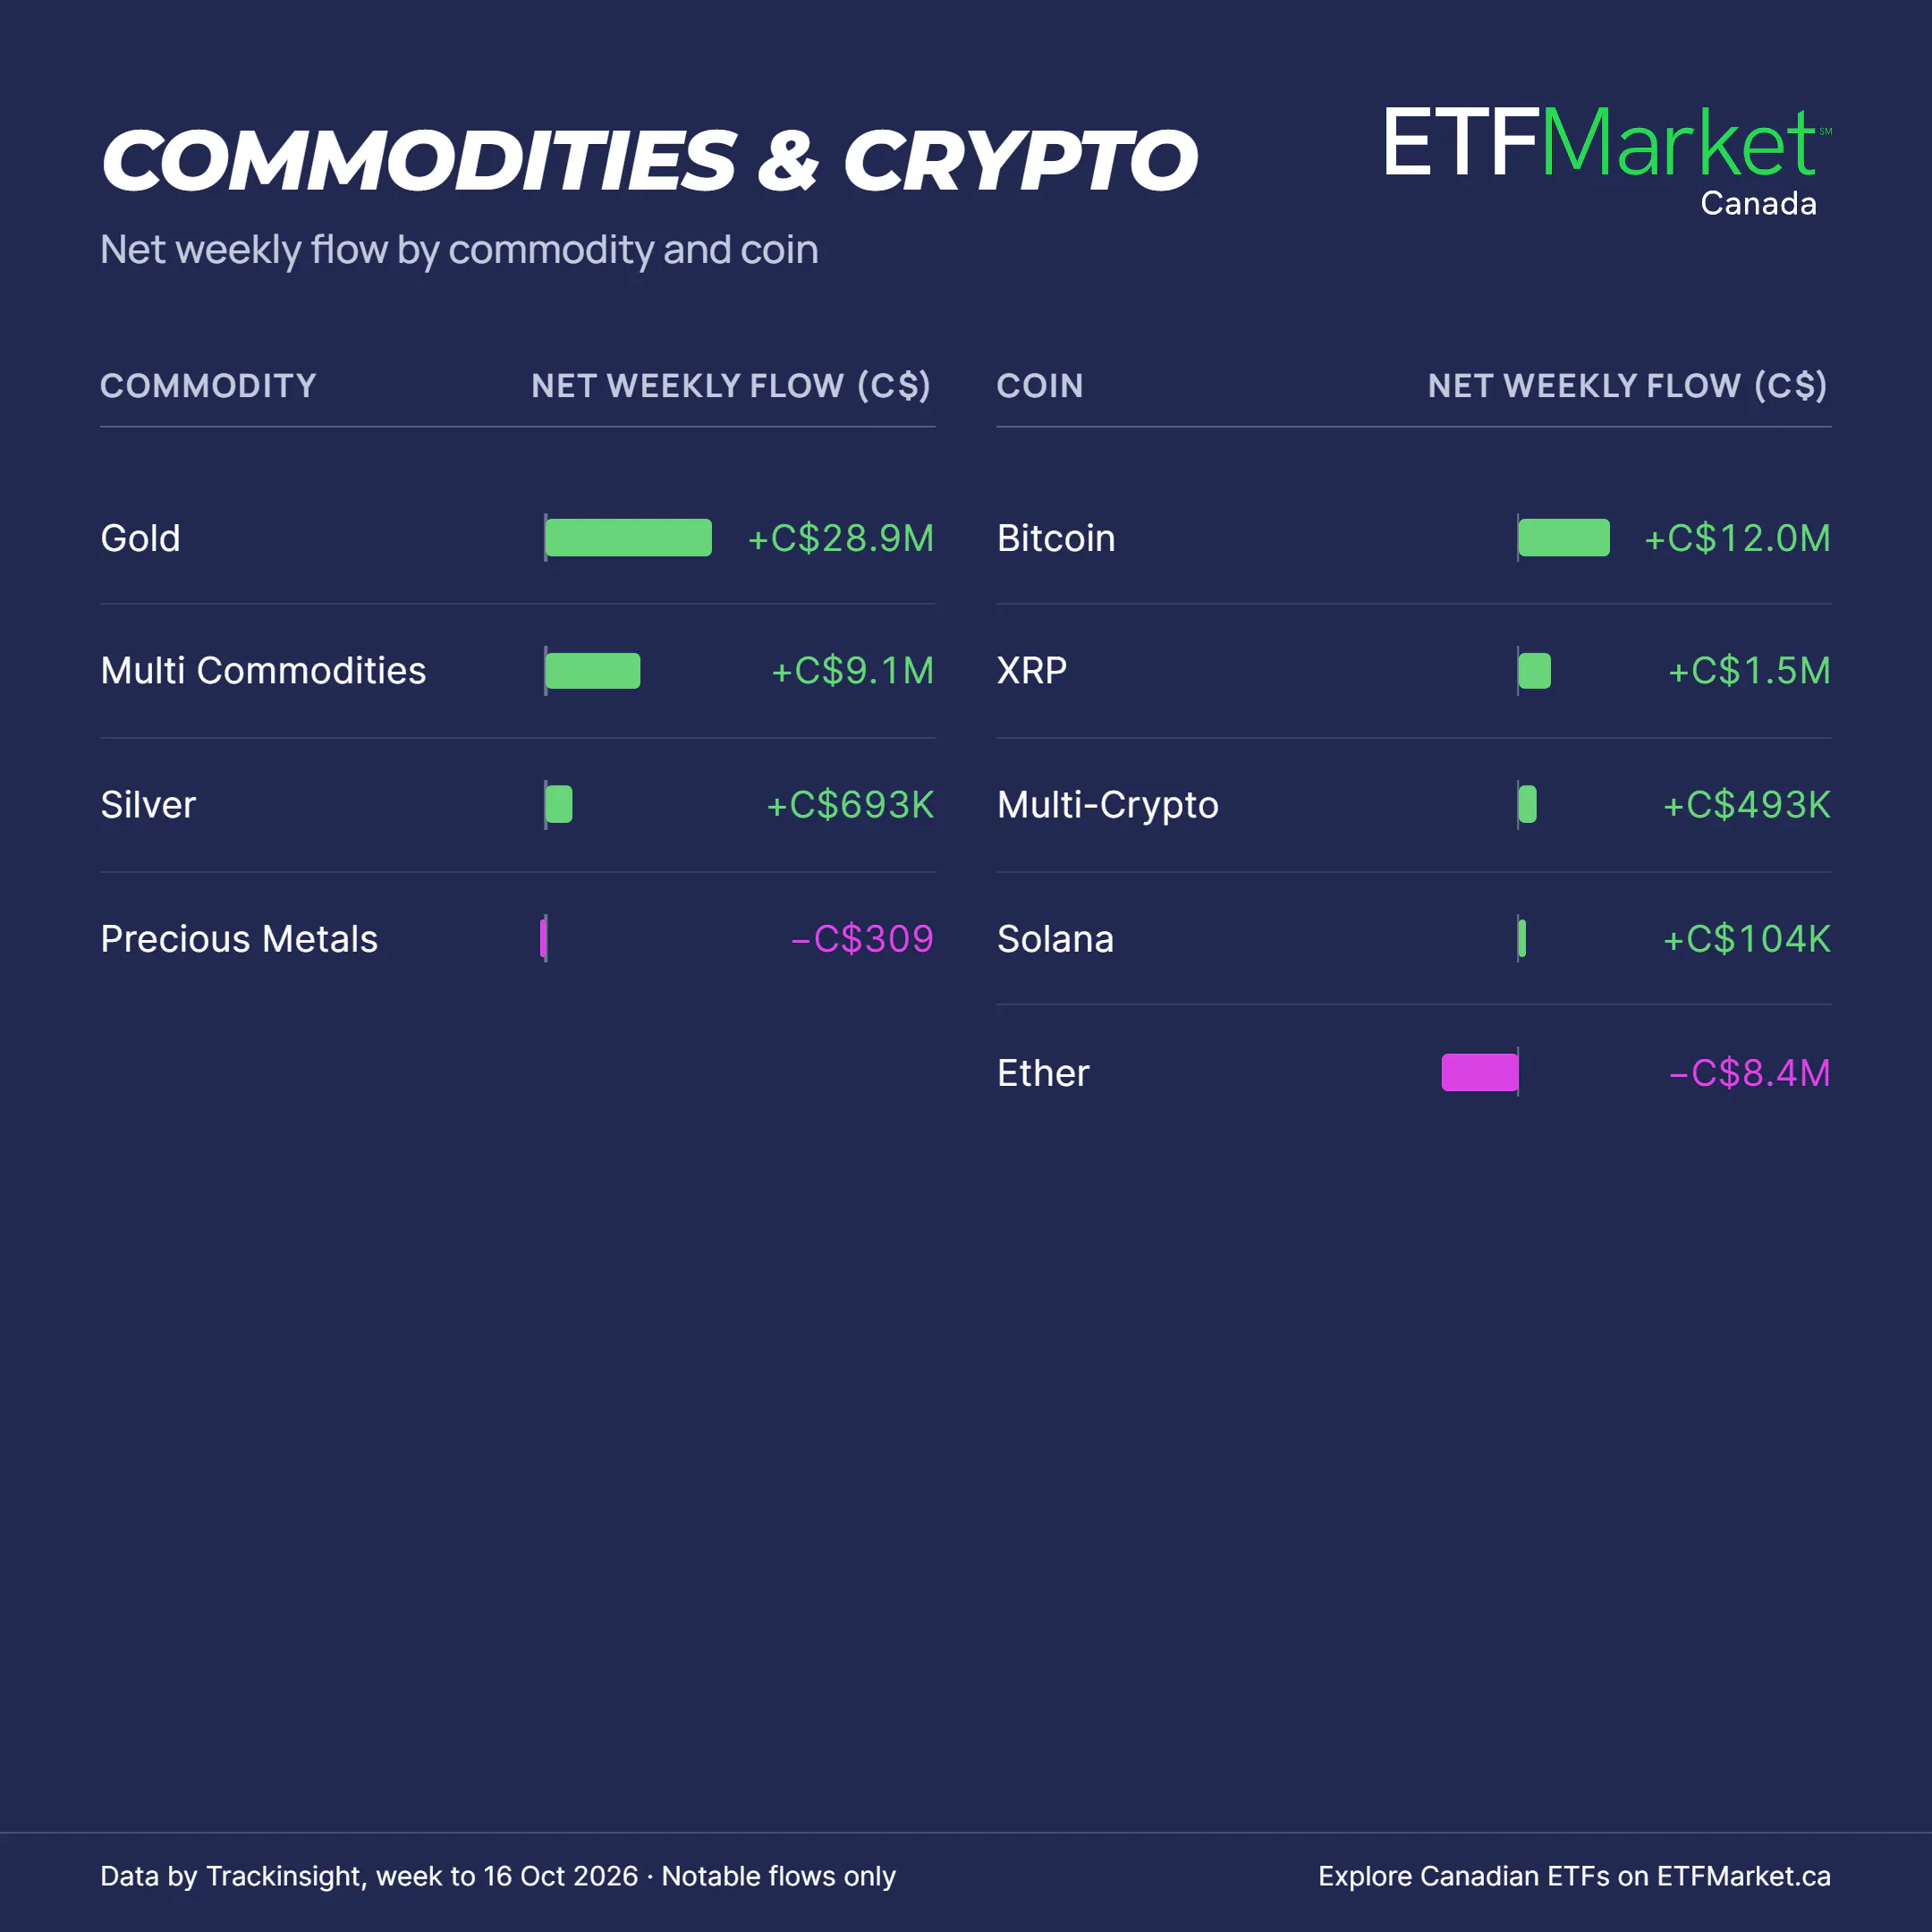
Gold led commodity inflows with C$28.9 million, followed by Multi Commodities at C$9.1 million and Silver at C$693.1 thousand.
Crude Oil and Natural Gas recorded no net flows during the week, while Precious Metals saw a marginal outflow of C$309.
Bitcoin Leads Crypto Inflows While Ether Records Outflows
Bitcoin led cryptocurrency ETF inflows with C$12.0 million, followed by XRP at C$1.5 million.
Multi-Cryptocurrency products attracted C$493.1 thousand, while Solana added C$104.4 thousand.
Ether recorded the largest cryptocurrency outflow at C$8.4 million.
Corporate Investment Grade Bonds Lead Fixed Income Flows
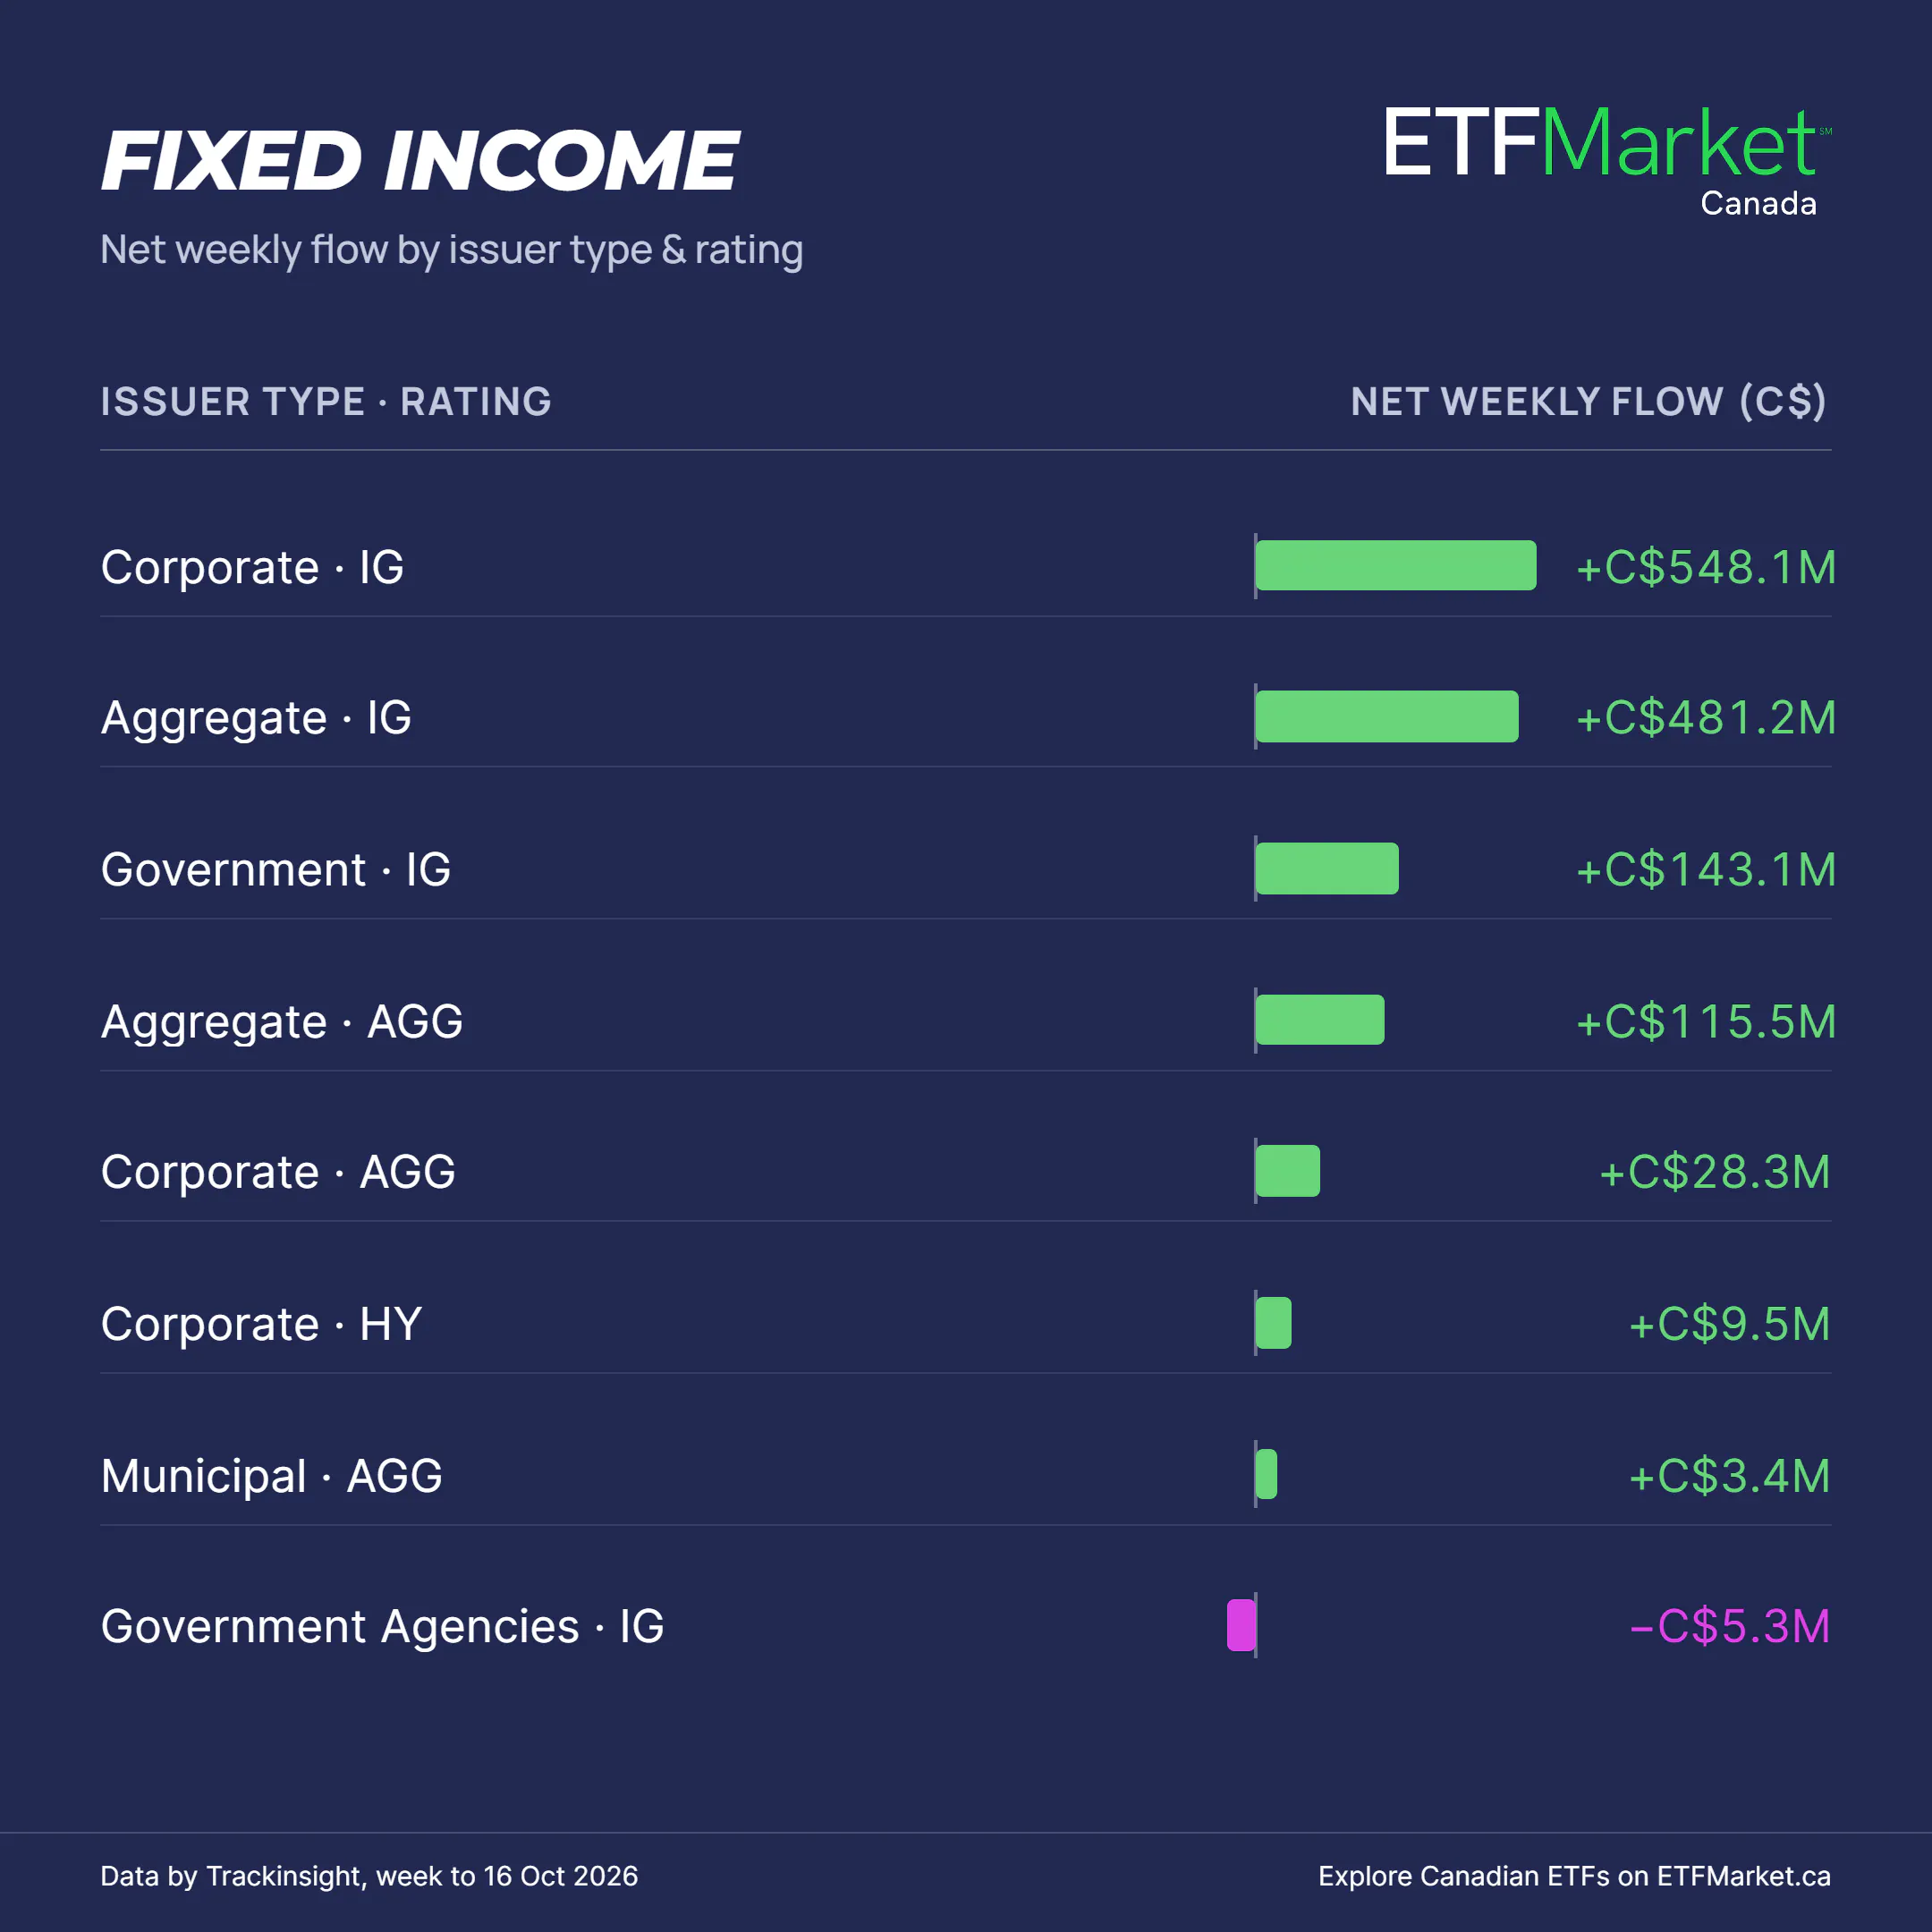
Corporate Investment Grade bond ETFs led fixed income inflows with C$548.1 million, followed by Aggregate Investment Grade products at C$481.2 million and Government Investment Grade ETFs at C$143.1 million.
Corporate Aggregate products attracted C$28.3 million, while Corporate High Yield gathered C$9.5 million. Municipal Aggregate ETFs added C$3.4 million.
Government Agencies Investment Grade ETFs recorded the largest fixed income outflow at C$5.3 million, while Government Aggregate products lost C$386.5 thousand.
Top 10 ETF Issuers by Weekly Net Inflows
- iShares: C$1.23 billion
- Vanguard: C$627.2 million
- BMO: C$432.6 million
- Fidelity: C$312.0 million
- CIBC: C$257.7 million
- TD Asset Management: C$196.1 million
- Global X: C$160.9 million
- Desjardins Investments: C$119.0 million
- Mackenzie Investments: C$101.6 million
- Manulife Investments: C$78.1 million
10 Most Popular ETFs by Weekly Net Inflows
- BMO Short Corporate Bond Index ETF (ZCS): C$680.6 million
- iShares S&P/TSX 60 Index ETF (XIU): C$436.1 million
- BMO Corporate Discount Bond ETF (ZCDB): C$210.4 million
- Vanguard S&P 500 Index ETF (VFV): C$180.6 million
- iShares Core S&P/TSX Capped Composite Index ETF (XIC): C$172.9 million
- iShares Core MSCI EAFE IMI Index ETF (XEF): C$113.1 million
- Vanguard All-Equity ETF Portfolio (VEQT): C$105.9 million
- iShares Core S&P Total U.S. Stock Market Index ETF (XTOT): C$90.2 million
- BMO MSCI EAFE Index ETF (ZEA): C$89.2 million
- BMO Aggregate Bond Index ETF (ZAG): C$83.3 million
Top 10 Performing Equity ETFs of the Week
- Global X Equal Weight Canadian Groceries & Staples Index ETF (MART): 7.98%
- iShares S&P/TSX Capped Consumer Staples Index ETF (XST): 7.96%
- Global X Equal Weight Canadian Telecommunications Index ETF (RING): 7.16%
- iShares S&P/TSX Capped Energy Index ETF (XEG): 6.31%
- Global X S&P/TSX Capped Energy Index Corporate Class ETF (HXE): 6.31%
- BMO Global Consumer Staples Hedged to CAD Index ETF (STPL): 5.33%
- BMO Equal Weight Oil & Gas Index ETF (ZEO): 4.83%
- Global X Equal Weight Canadian Oil & Gas Index ETF (NRGY): 4.82%
- Fidelity Canadian Large Cap Fund (FCLC): 4.80%
- iShares U.S. High Dividend Equity Index ETF (XHD): 4.59%
This article was prepared on October 19th, 2026 using Trackinsight ETF data. It is for informational purposes only and does not constitute investment advice. Please consult a registered financial professional before making any investment decision.