Canada Weekly ETF Flows | November 2-6, 2026
A recap of Canadian ETF flows, performance and market activity for November 2-6, 2026.


According to data by Trackinsight, Equity ETFs attracted CA$4.09 billion, while Fixed Income ETFs gathered CA$988.4 million. Multi-Asset ETFs recorded CA$326.1 million in inflows, followed by Commodity products at CA$18.3 million and Currency products at CA$12.4 million. Cryptocurrency products registered CA$2.5 million in net outflows.
Financials Lead Sector ETF Inflows While Utilities See Largest Outflows
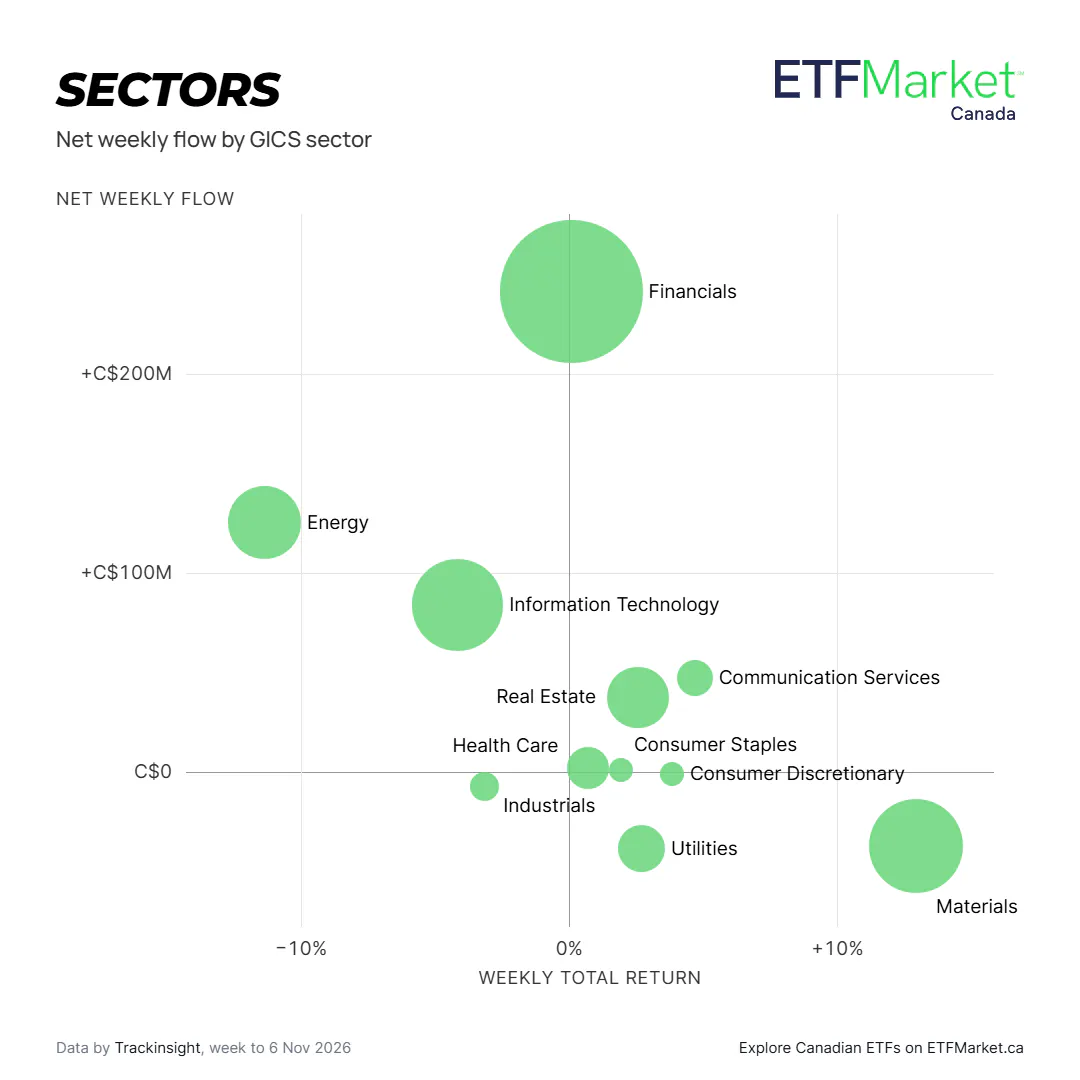
Financials ETFs recorded the largest sector inflows at CA$241.2 million, followed by Energy at CA$125.2 million.
Information Technology (CA$83.8 million), Communication Services (CA$47.5 million), and Real Estate (CA$37.5 million) also attracted inflows.
Utilities recorded the largest sector outflows at CA$38.4 million, followed by Materials (CA$37.3 million) and Industrials (CA$7.3 million).
Materials Lead Sector Returns While Energy Records Largest Decline
Materials led weekly sector returns at +12.92%, followed by Communication Services (+4.68%) and Consumer Discretionary (+3.83%).
Energy posted the weakest return at -11.37%, followed by Information Technology (-4.16%) and Industrials (-3.16%).
US and Canada Lead Geographic Equity ETF Inflows
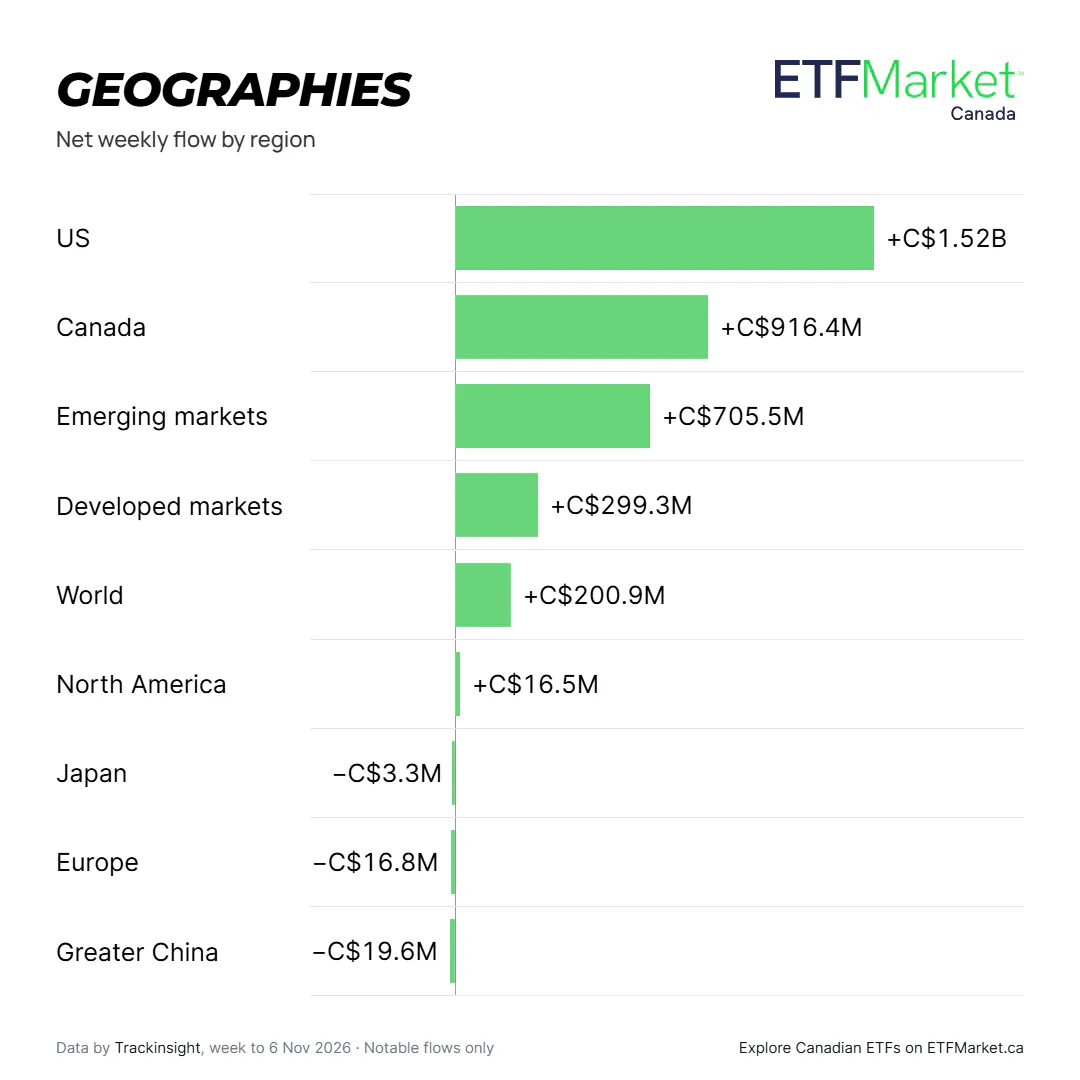
US exposures recorded the largest geographic inflows at CA$1.52 billion, followed by Canada at CA$916.4 million.
Emerging markets (CA$705.5 million), Developed markets (CA$299.3 million), and World (CA$200.9 million) also attracted inflows.
On the outflow side, Greater China (CA$19.6 million), Europe (CA$16.8 million), and Japan (CA$3.3 million) recorded the largest withdrawals.
Greater China Leads Geographic Returns While Asia Records Weakest Result
Greater China posted the strongest weekly geographic return at +9.73%, followed by India (+9.31%) and China (+6.90%).
At the other end, Asia returned -14.71%, followed by South Korea (-13.78%) and Developed Pacific (-6.18%).
Japan (-4.95%) and Emerging markets (-2.12%) also ranked among the weakest geographic exposures.
Artificial Intelligence Leads Thematic Inflows While China Disruptive Technology Tops Returns
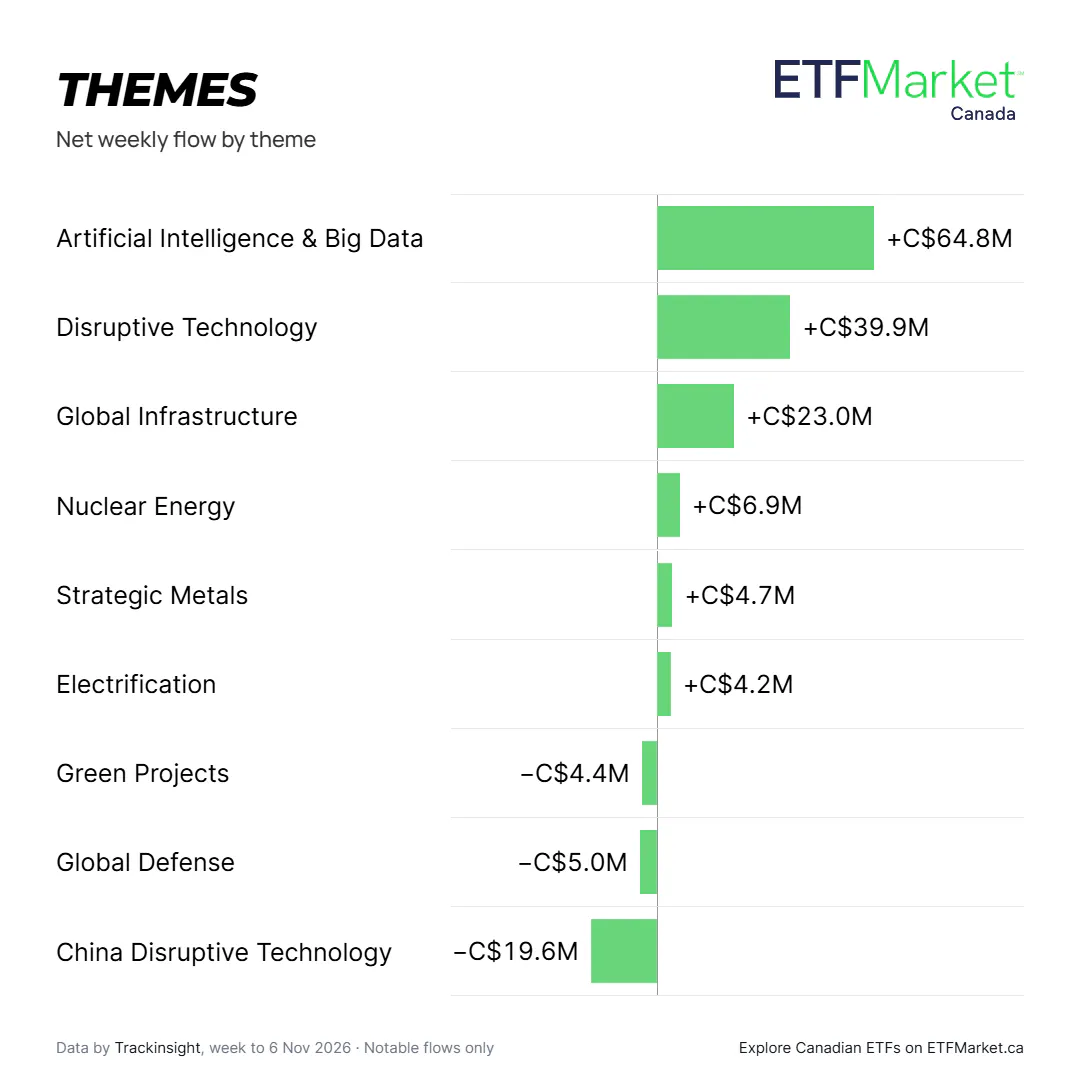
Artificial Intelligence & Big Data recorded the largest thematic inflows at CA$64.8 million, followed by Disruptive Technology at CA$39.9 million.
Global Infrastructure (CA$23.0 million), Nuclear Energy (CA$6.9 million), and Strategic Metals (CA$4.7 million) also gathered inflows.
In performance, China Disruptive Technology led with a +9.73% weekly return, followed by Cannabis & Psychedelics (+6.33%) and Video Games & iGaming (+6.03%).
China Disruptive Technology recorded the largest thematic outflows at CA$19.6 million, followed by Global Defense at CA$5.0 million and Green Projects at CA$4.4 million.
Cybersecurity posted the weakest thematic return at -10.40%, followed by North America Energy Infrastructure (-8.55%) and Artificial Intelligence & Big Data (-7.84%).
Aggregate Investment Grade Leads Fixed Income ETF Inflows
Aggregate Investment Grade recorded the largest fixed income category inflows at CA$450.5 million.
Corporate Investment Grade (CA$379.6 million), Government Investment Grade (CA$45.3 million), Corporate High Yield (CA$35.4 million), and Corporate Aggregate (CA$32.6 million) followed.
Government Aggregate recorded CA$12.9 million in net outflows.
Gold Leads Commodity ETP Inflows While Silver Records Outflows
Gold attracted CA$19.1 million during the week, followed by Multi Commodities at CA$2.6 million.
Precious Metals gathered CA$8,897, while Silver recorded CA$51,381 in outflows.
Bitcoin Leads Cryptocurrency ETP Inflows While Ether Sees Largest Outflows
Bitcoin products attracted CA$536,523, the largest cryptocurrency inflow of the week, followed by XRP at CA$511,892 and Multi-Cryptocurrency products at CA$370,950.
Ether recorded the largest outflows at CA$3.3 million, followed by Solana at CA$596,743.
Top 10 ETF Issuers by Net Inflows This Week
- Vanguard: CA$1.24 billion
- BMO: CA$1.15 billion
- iShares: CA$1.11 billion
- Fidelity: CA$471.7 million
- TD Asset Management: CA$222.1 million
- CI: CA$219.6 million
- Desjardins Investments: CA$201.9 million
- Manulife Investments: CA$141.7 million
- Global X: CA$132.4 million
- CIBC: CA$113.5 million
Top 10 Most Popular ETFs by Net Inflows This Week
- Vanguard S&P 500 Index ETF - CAD (VFV): CA$366.6 million
- BMO S&P 500 Index ETF - CAD (ZSP): CA$340.0 million
- BMO Aggregate Bond Index ETF - CAD (ZAG): CA$276.9 million
- iShares ESG Aware MSCI Emerging Markets Index ETF - Distributing - CAD (XSEM): CA$256.0 million
- Vanguard All-Equity ETF Portfolio - CAD (VEQT): CA$200.6 million
- BMO Equal Weight Banks Index ETF - CAD (ZEB): CA$199.7 million
- BMO MSCI Emerging Markets Index ETF - CAD (ZEM): CA$184.4 million
- iShares Core MSCI EAFE IMI Index ETF - CAD (XEF): CA$168.2 million
- iShares Core MSCI Emerging Markets IMI Index ETF - CAD (XEC): CA$144.5 million
- iShares S&P/TSX Capped Energy Index ETF - CAD (XEG): CA$137.0 million
Top 10 Performing Equity ETFs This Week
- Global X Gold Producers Index ETF - CAD (GLDX): +16.10%
- BMO Junior Gold Index ETF - CAD (ZJG): +16.00%
- iShares S&P/TSX Global Gold Index ETF - CAD (XGD): +15.57%
- BMO Equal Weight Global Gold Index ETF - CAD (ZGD): +15.12%
- RBC Global Precious Metals Fund - CAD (RGPM): +15.05%
- Harvest Global Gold Giants Index ETF - CAD Hedged (HGGG): +14.62%
- Global X Silver Miners Index ETF - CAD (SLVX): +12.82%
- iShares S&P/TSX Capped Materials Index ETF - CAD (XMA): +11.39%
- Ninepoint Gold and Precious Minerals Fund - CAD (GLDE): +10.06%
- BMO MSCI India Selection Equity Index ETF - CAD (ZID): +10.00%
This article was prepared on November 9th, 2026 using Trackinsight ETF data. It is for informational purposes only and does not constitute investment advice. Please consult a registered financial professional before making any investment decision.