Canadian Investors: S&P/TSX Capped Composite vs S&P/TSX 60?
Here's how to decide between which index to buy and hold.


I'm a strong advocate for passive investing using index ETFs. Over the long run, this approach beats the majority of not only stock pickers but also expensive actively managed funds out there. A simple buy-and-hold mentality along with consistent contributions can create lasting generational wealth with little to no effort.
That being said, one question passive Canadian investors tend to wrestle with is whether to buy an index fund that tracks just the S&P/TSX 60 Index, or the S&P TSX Capped Composite Index. Both can be excellent, low-cost, tax-efficient core portfolio holdings, but how do investors decide which one to pick with so many options out there?
What are the Two Options for Canadian Investors?
Most readers are probably very familiar with the S&P/TSX 60, a market-capitalization weighted index of the 60 largest publicly traded Canadian companies. Over time, the S&P/TSX 60 has evolved into a benchmark for professional fund managers and retail investors to compete against.
ETFs tracking the S&P/TSX 60 are highly popular, with billions in assets under management, high liquidity, and minimal bid-ask spreads. The largest sectors in this index are financial, energy, and utilities. In fact, the first Canadian ETF launched was designed to track this index!
The Canadian stock market doesn't end at just the S&P/TSX 60 though. There are still another 200+ mid and small-cap stocks floating around. Combining the S&P/TSX 60 and these 200+ other stocks gives us the S&P/TSX Capped Composite Index. The index is "capped" in that no single stock can account for more than 10% of the index. This would prevent a situation like when Nortel accounted for 40% of the TSX in 2000.
By weight, around 85% of this is the S&P/TSX 60, with around 10% in mid-caps and 5% in small caps, largely mining sector stocks. The S&P/TSX Capped Composite is still heavily influenced by the S&P/TSX 60, given the large overlap of commonly held large-cap stocks between them.
Conveniently, BlackRock iShares offers two low-cost ETFs for tracking these indexes:
- iShares S&P/TSX 60 Index ETF (XIU): 0.20% expense ratio.
- iShares Core S&P/TSX Capped Composite Index ETF (XIC): 0.06% expense ratio.
S&P/TSX Capped Composite vs S&P/TSX 60: What's the Difference?
Very little actually unless you want to get very technical and detailed. For the average retail investor, their performance is indistinguishable at first glance. Take a look at the following backtests from 2002 to present:

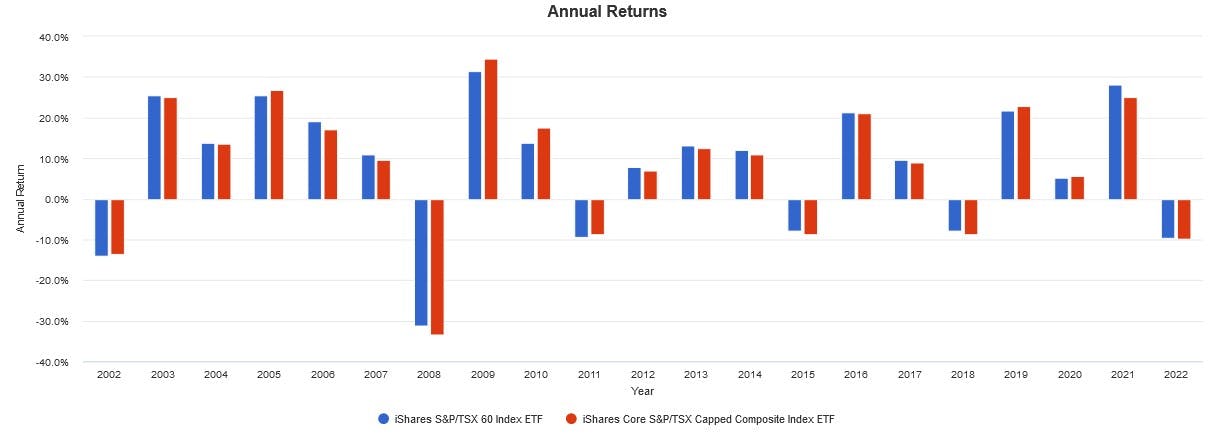
Because XIC holds 85% XIU, the two funds have a very high correlation. As of writing, it's around 0.99 measured monthly over various rolling 5-, 10-, and 20-year periods. The discernable difference here is slightly higher volatility from XIC due to the inclusion of some mid and small-cap stocks. Overall CAGR, volatility, and drawdowns remain similar.
The market conditions of the previous decade have been favourable for large-caps, and thus XIU has benefitted more. However, notice how both indexes take turns outperforming – this is due to the cyclical nature of small vs large-cap stocks. I don’t have a crystal ball here, so in my opinion, it's best to stick with broad diversification moving forward.
Which One is Ideal?
Honestly, it's a coin toss here. It depends on your outlook for small vs large-cap stocks. If you want lower volatility and higher dividend yields, the 60 large-cap blue-chip stocks in XIU might suit your needs. If you're in favour of broad diversification and tracking the total Canadian market as closely as possible, XIC wins. From a fee perspective, XIC is significantly cheaper. For high liquidity, great volume, and minimal bid-ask spreads, XIU wins by a mile.
Over long periods of time, XIU and XIC will likely perform virtually identically, barring some small intra-year tracking error. The minimal amount of small and mid-caps in XIC is unlikely to differentiate it much from XIU in the long run. From a strict diversification perspective, XIC is broader and holds more stocks, but takes on very slightly higher volatility for a tiny bit more potential return.
A great alternative is using both as tax-loss harvesting pairs given their high correlation and similar holdings, yet different underlying indexes. If you're not familiar with tax-loss harvesting, I suggest giving this article a read.
Disclaimer: This article is limited to the dissemination of general information pertaining to investment strategies and financial planning and does not constitute an offer to issue or sell, or a solicitation of an offer to subscribe, buy, or acquire an interest in, any securities, financial instruments or other services, nor does it constitute a financial promotion, investment advice or an inducement or incitement to participate in any product, offering or investment.