ETF Comparison: QCH vs. XCH
A side-by-side look at QCH and XCH, two Canadian-listed ETFs offering exposure to Chinese equities, comparing fees, sector exposure, and performance.

China’s significance to the global economy is undeniable, given its manufacturing prowess and dominance in critical minerals production and refinement. From an investment perspective, China offers a diverse business landscape, giving investors exposure to firms with a strong value proposition and demonstrable growth over time.
ETF Comparison: QCH vs. XCH
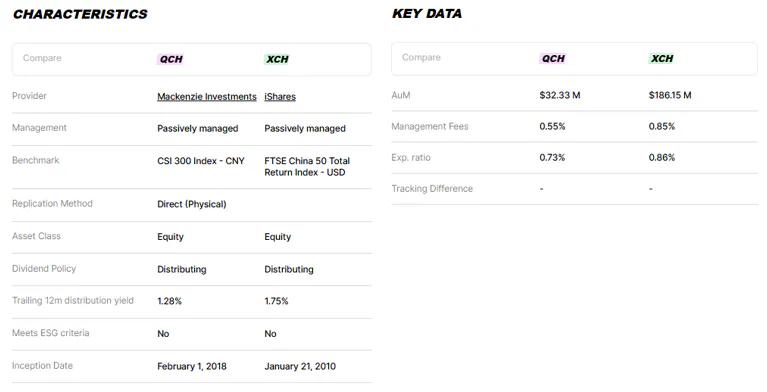
For Canadian investors interested in Chinese equities, the Mackenzie China A-Shares CSI 300 Index ETF (Ticker: QCH) and iShares China Index ETF (Ticker: XCH) are two solutions that provide exposure to the regional equity asset class. Using Cboe Canada’s ETF Market Comparison tool, investors can gain both qualitative and quantitative insights into how the funds differ.
Both ETFs are passively managed, with QCH’s benchmark being the CSI 300 Index and XCH’s being the FTSE China 50 Index. Although both indices are China-focused, the former tracks the performance of the top 300 stocks traded on the Shanghai and Shenzhen Stock Exchange, while the latter reflects 50 of the largest and most liquid Chinese stocks listed and traded on the Stock Exchange of Hong Kong.
Regarding other qualitative differences between the funds, XCH is significantly larger in size (i.e. AUM), whereas QCH has a lower price point (i.e., Management Fee and Management Expense Ratio).
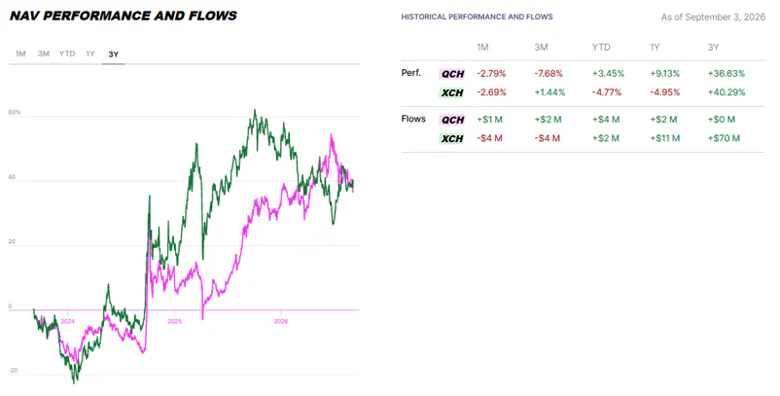
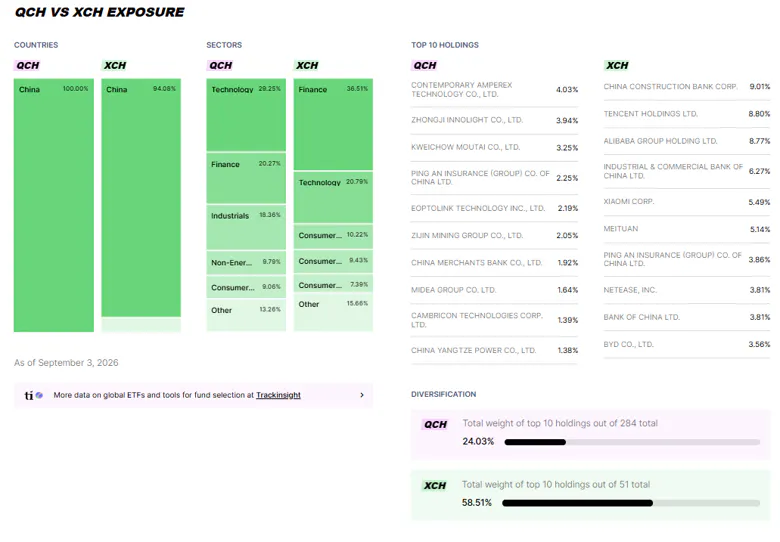
From a performance perspective, as shown in the growth chart, both investment solutions have had a volatile investment experience, which is understandable given the market events that have impacted China’s economy in recent years. However, as seen in the trailing performance, QCH has exhibited a positive return profile over longer time periods (i.e., year-to-date, 1-year, and 3-year). The performance difference between the two ETFs can be attributed to their underlying exposures, given that QCH is more broadly diversified than XCH. As captured in the following image, over one-third (36.51%) of XCH’s sector exposure is in the Finance sector, with the ETF’s top ten holdings accounting for approximately 60% of the total weight. Conversely, QCH’s largest sector allocation (i.e. 29.25%) is in the Technology sector.
Takeaway
QCH has demonstrated better performance and charges a lower fee than XCH. Furthermore, as shown by its composition profile, QCH has much broader exposure to Chinese equities, allowing it to benefit from different segments of the economy.
This article was written on September 7th, 2026. Please note that this article is for information purposes only and does not in any way constitute investment advice. It is essential that you seek advice from a registered financial professional prior to making any investment decision.