Canada Weekly ETF Flows | October 26-30, 2026
A recap of Canadian ETF flows, performance and market activity for October 26-30, 2026.


According to data by Trackinsight, Equity ETFs attracted CA$2.43 billion and Fixed Income ETFs attracted CA$1.11 billion. Multi-Asset ETFs gathered CA$330.0 million and Commodity products added CA$108.5 million. Cryptocurrency products recorded CA$4.0 million in net outflows.
Financials Lead Sector ETF Inflows as Utilities Sees Largest Outflow
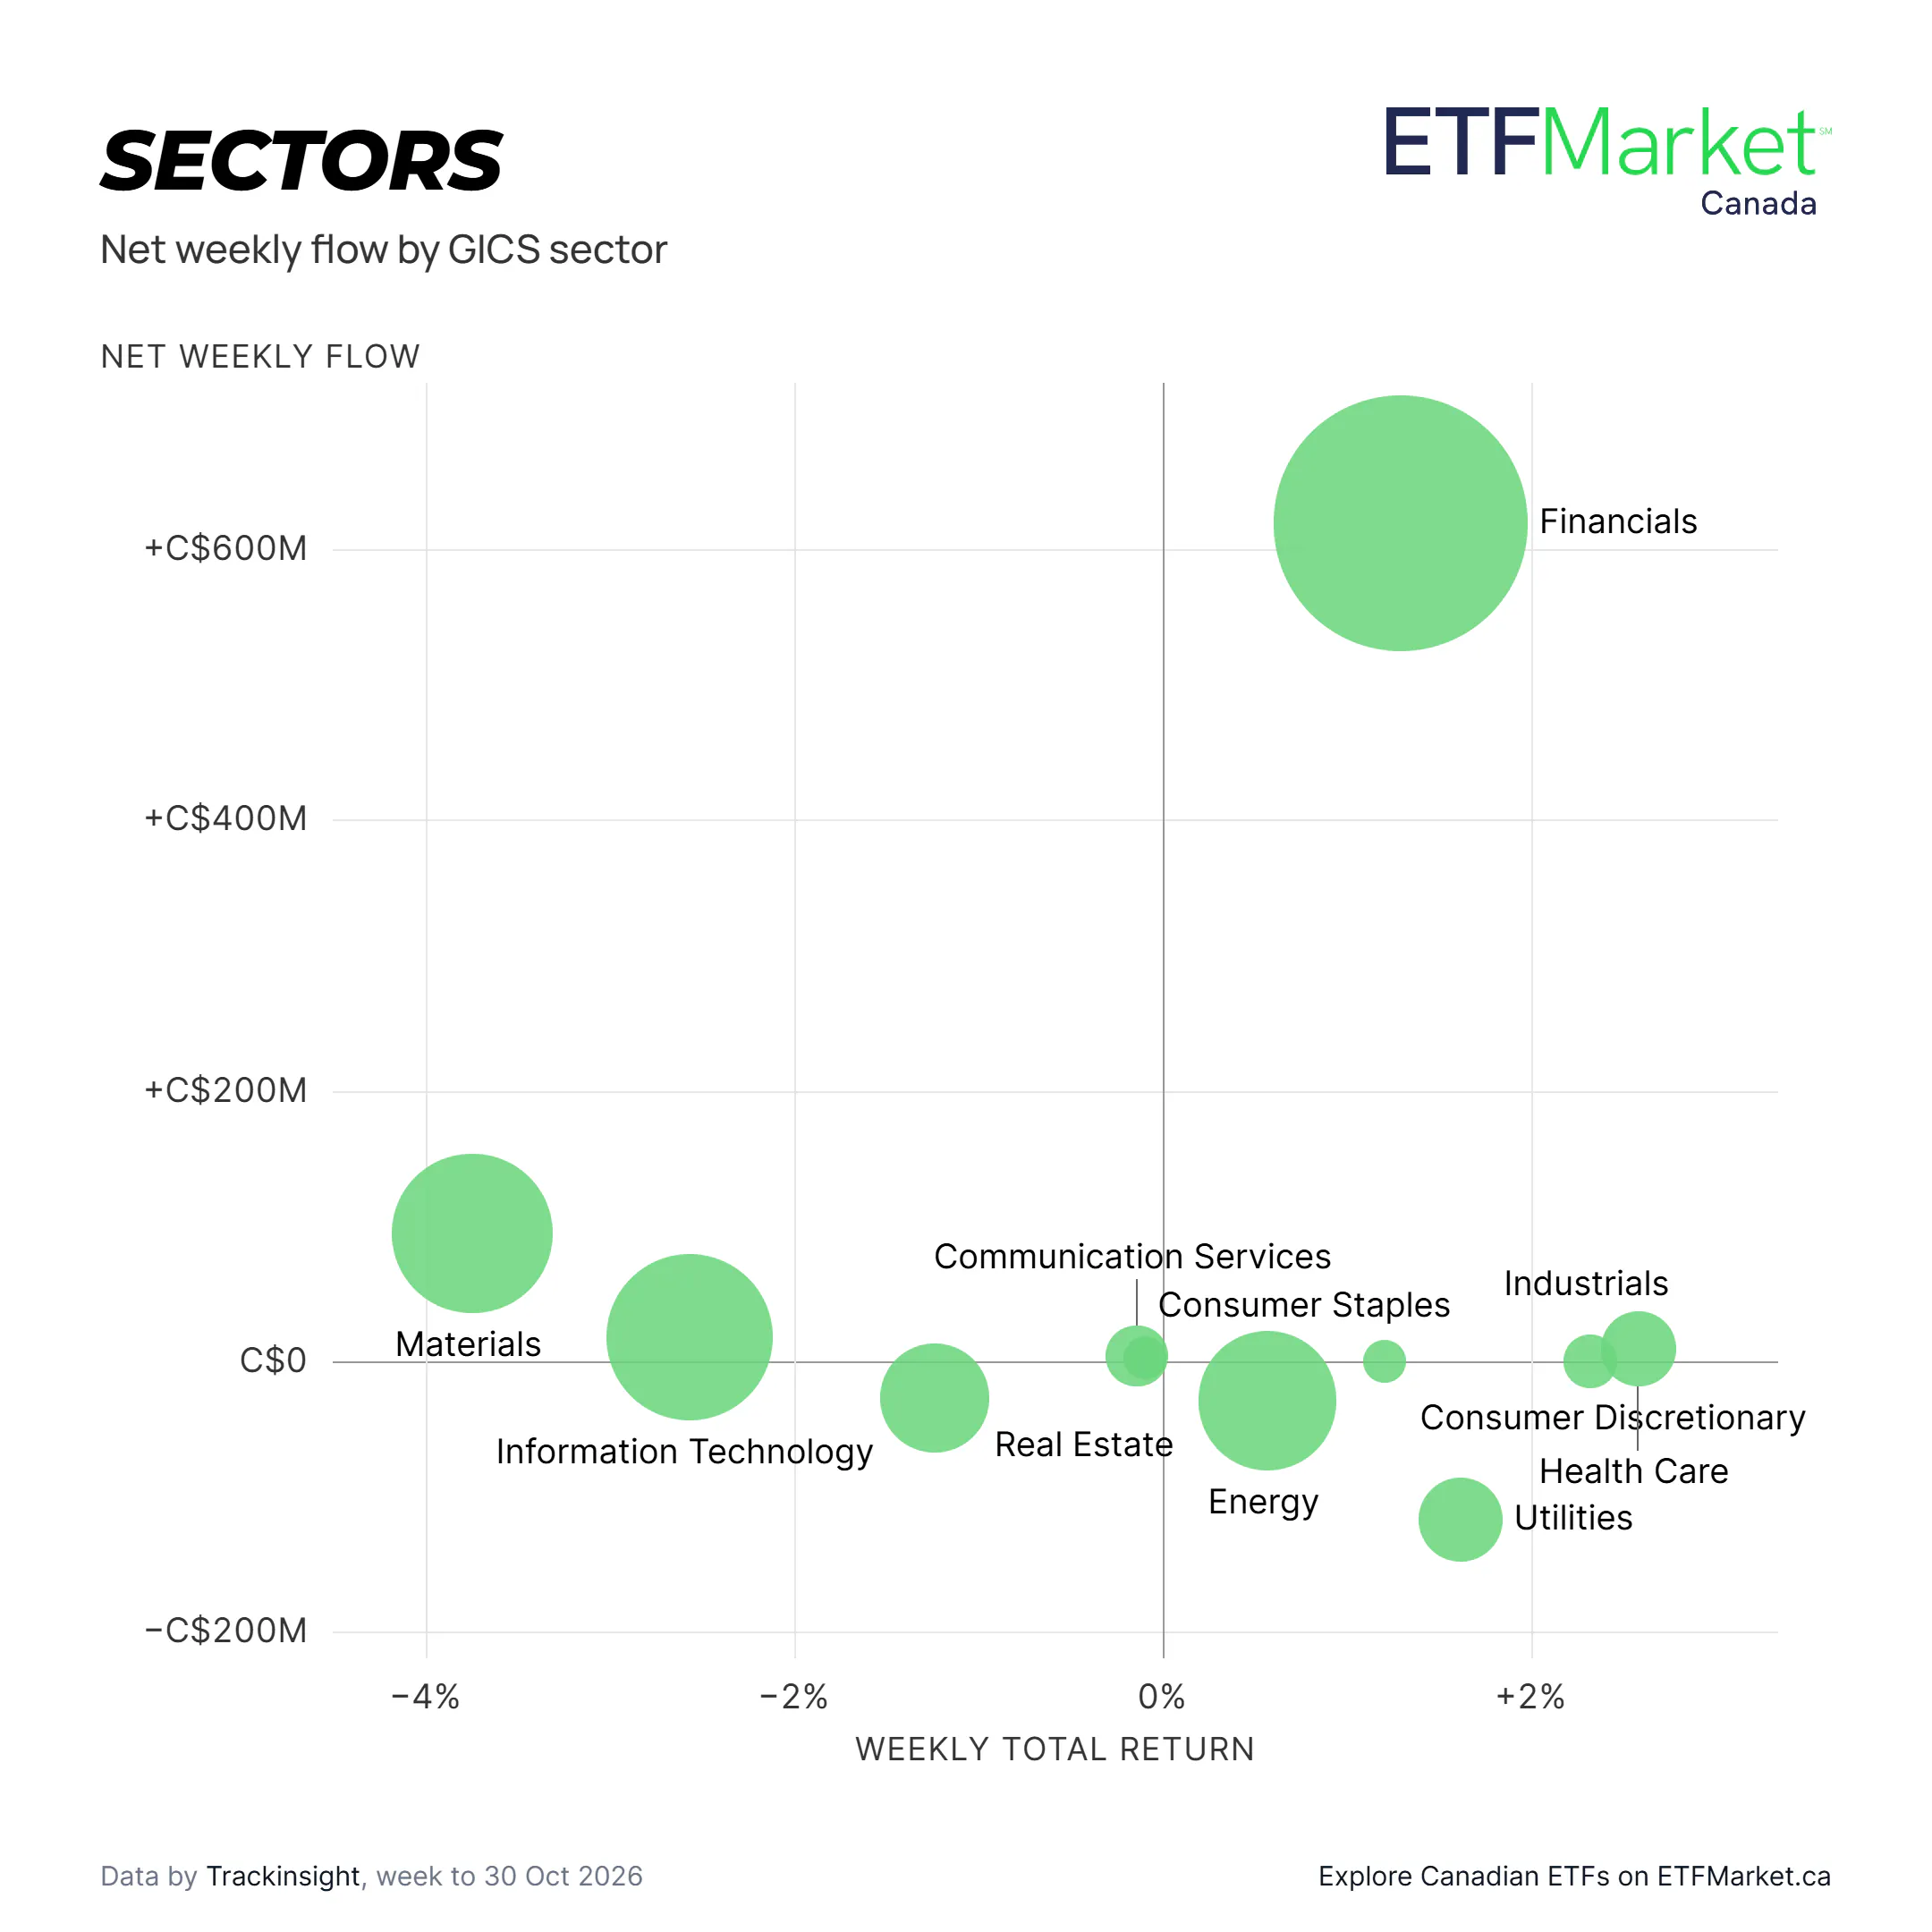
Financials ETFs recorded the largest sector inflow at CA$619.7 million.
Materials (CA$94.0 million) and Information Technology (CA$17.8 million) also attracted inflows, followed by Health Care (CA$9.2 million).
Utilities (CA$117.3 million), Energy (CA$29.8 million), and Real Estate (CA$28.0 million) recorded the largest sector outflows.
Health Care Leads Sector Returns While Materials Records Largest Decline
Health Care led weekly sector returns at +2.59%, followed by Industrials at +2.33%. Materials posted the weakest return at -3.74%, followed by Information Technology at -2.57%.
Canada and US Lead Geographic Equity ETF Inflows
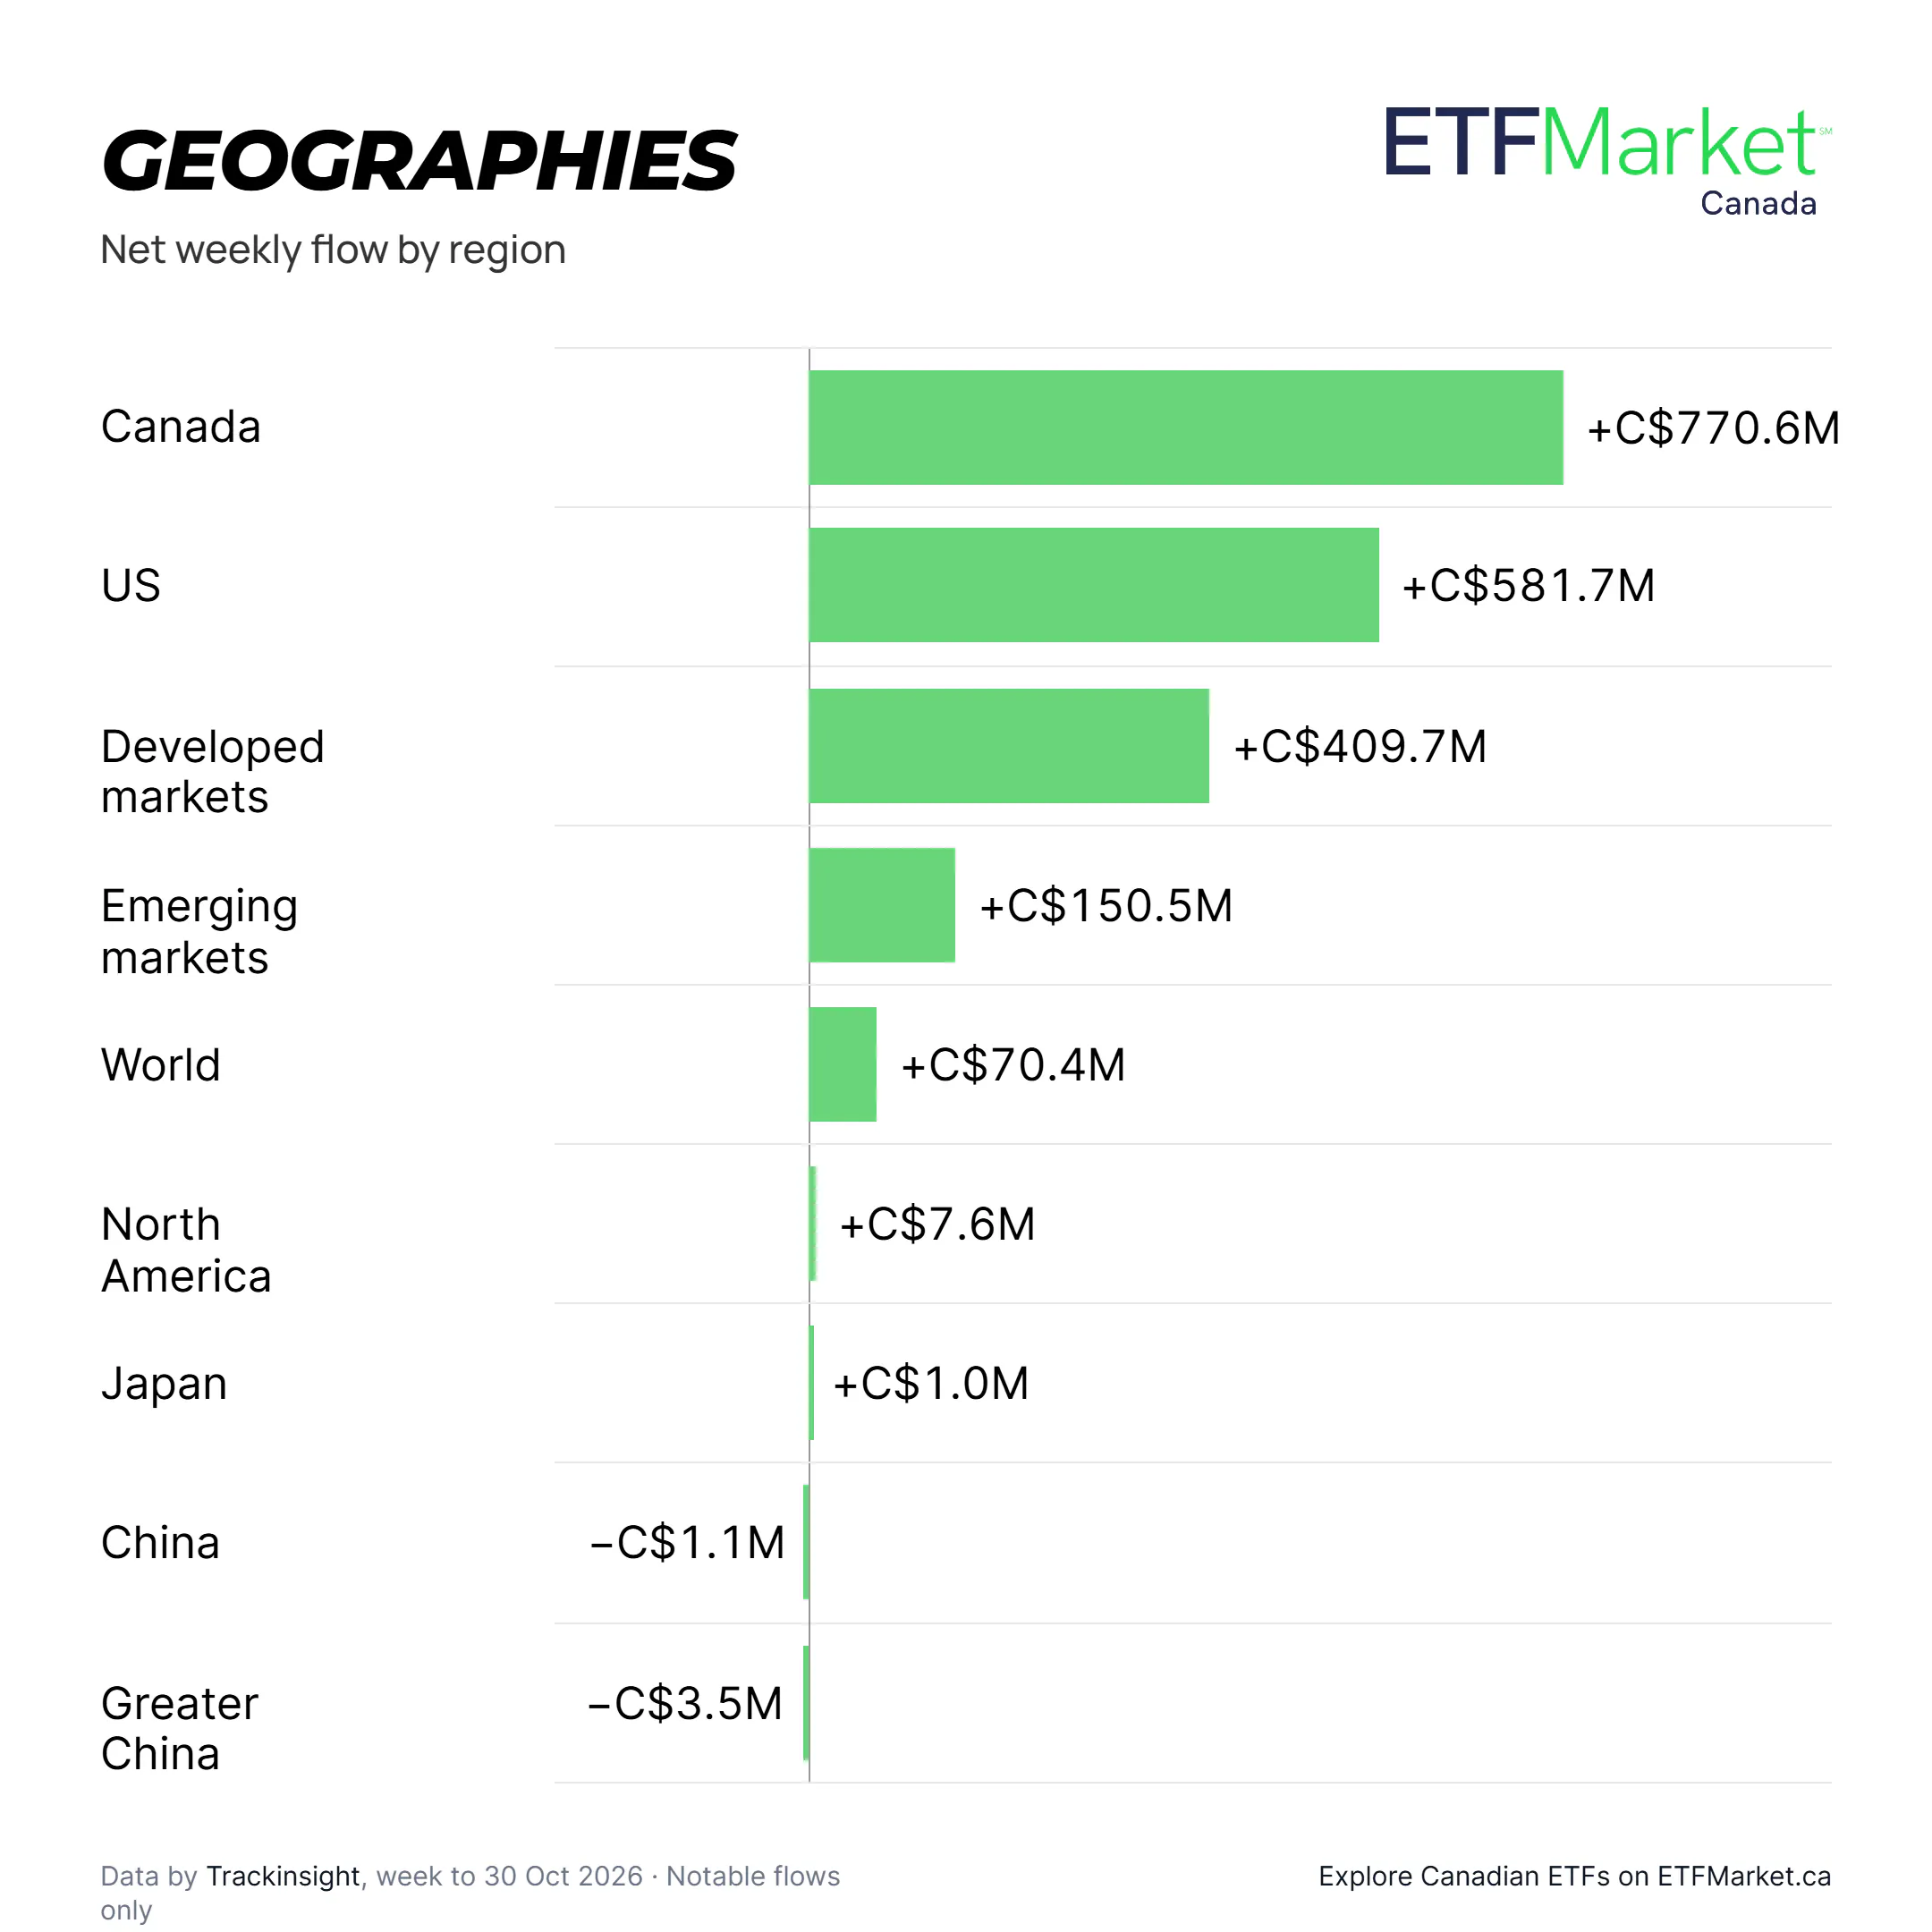
Canada exposures recorded the largest geographic inflow at CA$770.6 million, followed by US at CA$581.7 million.
Developed markets (CA$409.7 million), Emerging markets (CA$150.5 million), and World (CA$70.4 million) also attracted inflows.
On the outflow side, Greater China (CA$3.5 million), China (CA$1.1 million), and Australia (CA$0.8 million) recorded the largest withdrawals.
South Korea Leads Geographic Returns as Latin America Records Weakest Result
South Korea posted the strongest weekly geographic return at +3.14%, followed by India at +2.27%.
At the other end, Latin America returned -12.40% and Greater China posted -2.94%.
Emerging markets (-1.36%), Japan (-0.69%), and US (-0.56%) also ranked among the weakest geographic exposures.
Disruptive Technology Leads Thematic Inflows While BioTech & Genomics Leads Returns
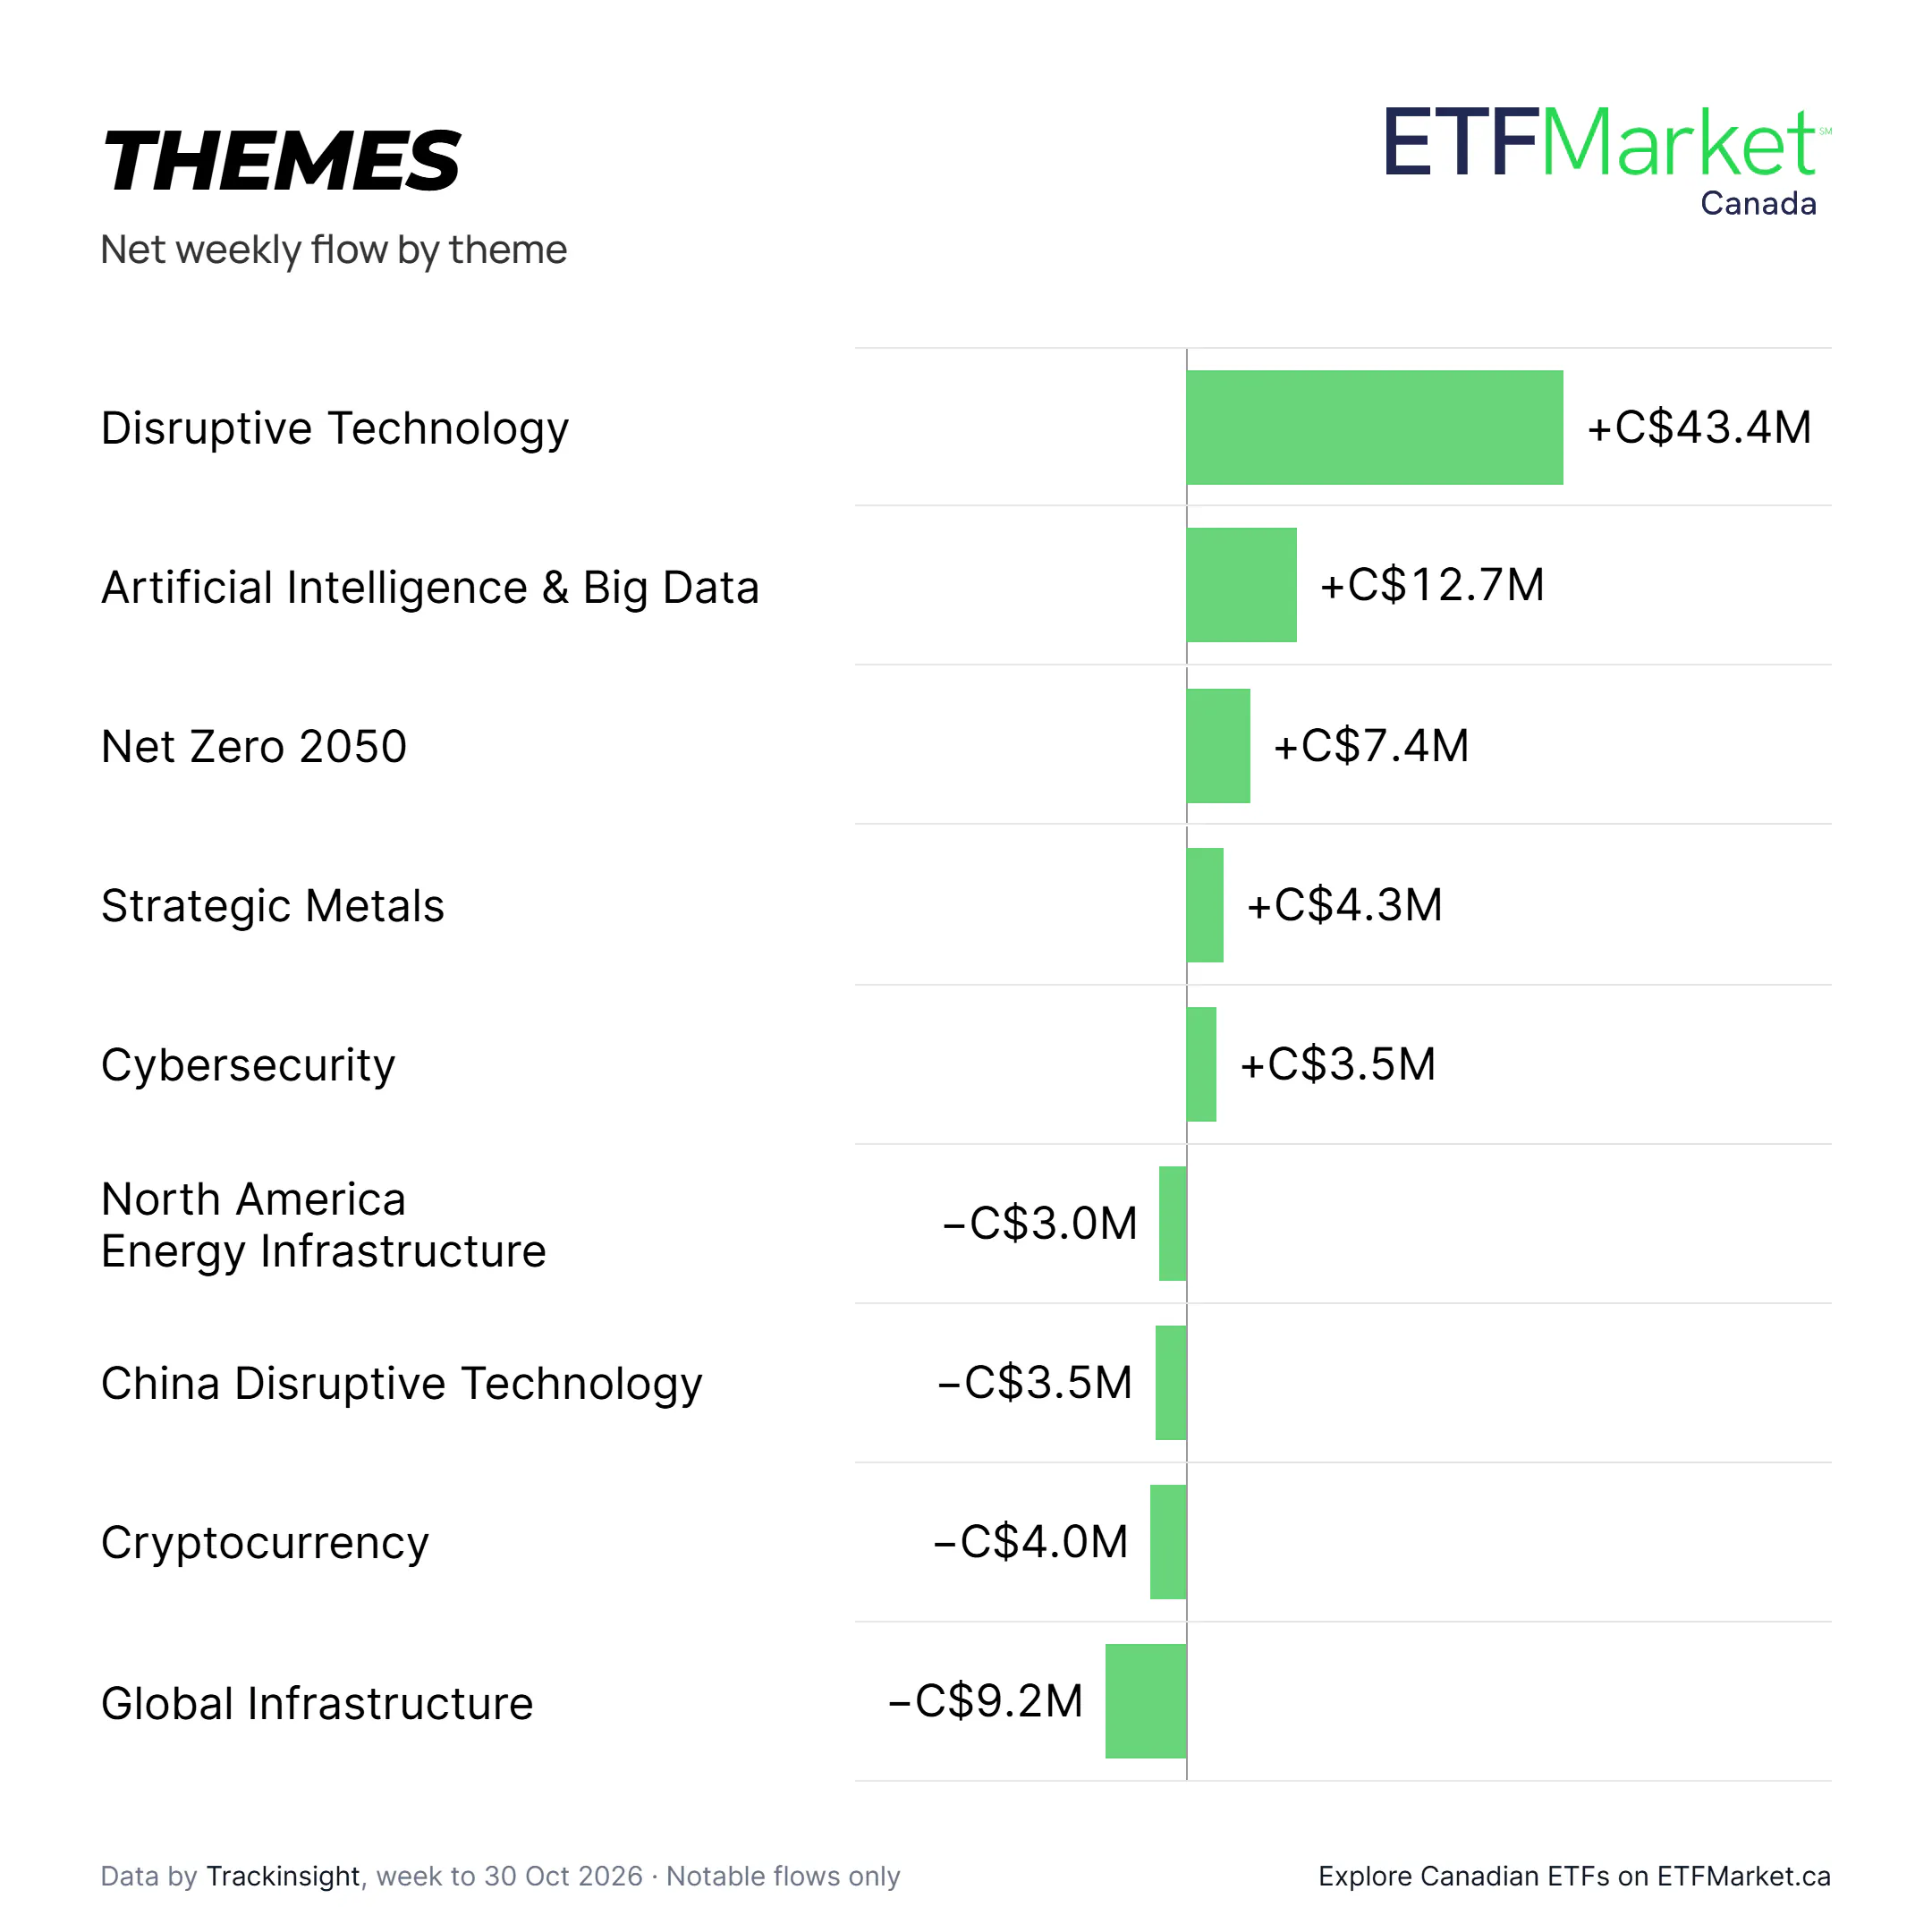
Disruptive Technology recorded the largest thematic inflow at CA$43.4 million, ahead of Artificial Intelligence & Big Data at CA$12.7 million.
Net Zero 2050 (CA$7.4 million), Strategic Metals (CA$4.3 million), and Cybersecurity (CA$3.5 million) also gathered inflows.
In performance, BioTech & Genomics led with a +4.69% weekly return. US Defense returned +3.47% and Global Defense returned +2.73%.
Global Infrastructure had the largest thematic outflow at CA$9.2 million, followed by Cryptocurrency at CA$4.0 million. Cryptocurrency recorded the weakest thematic return at -5.89%.
Aggregate Investment Grade Leads Fixed Income ETF Inflows
Aggregate Investment Grade recorded the largest fixed income category inflow at CA$493.5 million.
Corporate Aggregate (CA$206.7 million), Corporate High Yield (CA$113.7 million), and Government Investment Grade (CA$39.1 million) followed.
Government Aggregate (CA$7.6 million) and Government Agencies Investment Grade (CA$4.6 million) recorded the largest outflows.
Gold Leads Commodity ETP Flows While Precious Metals Records Largest Outflow
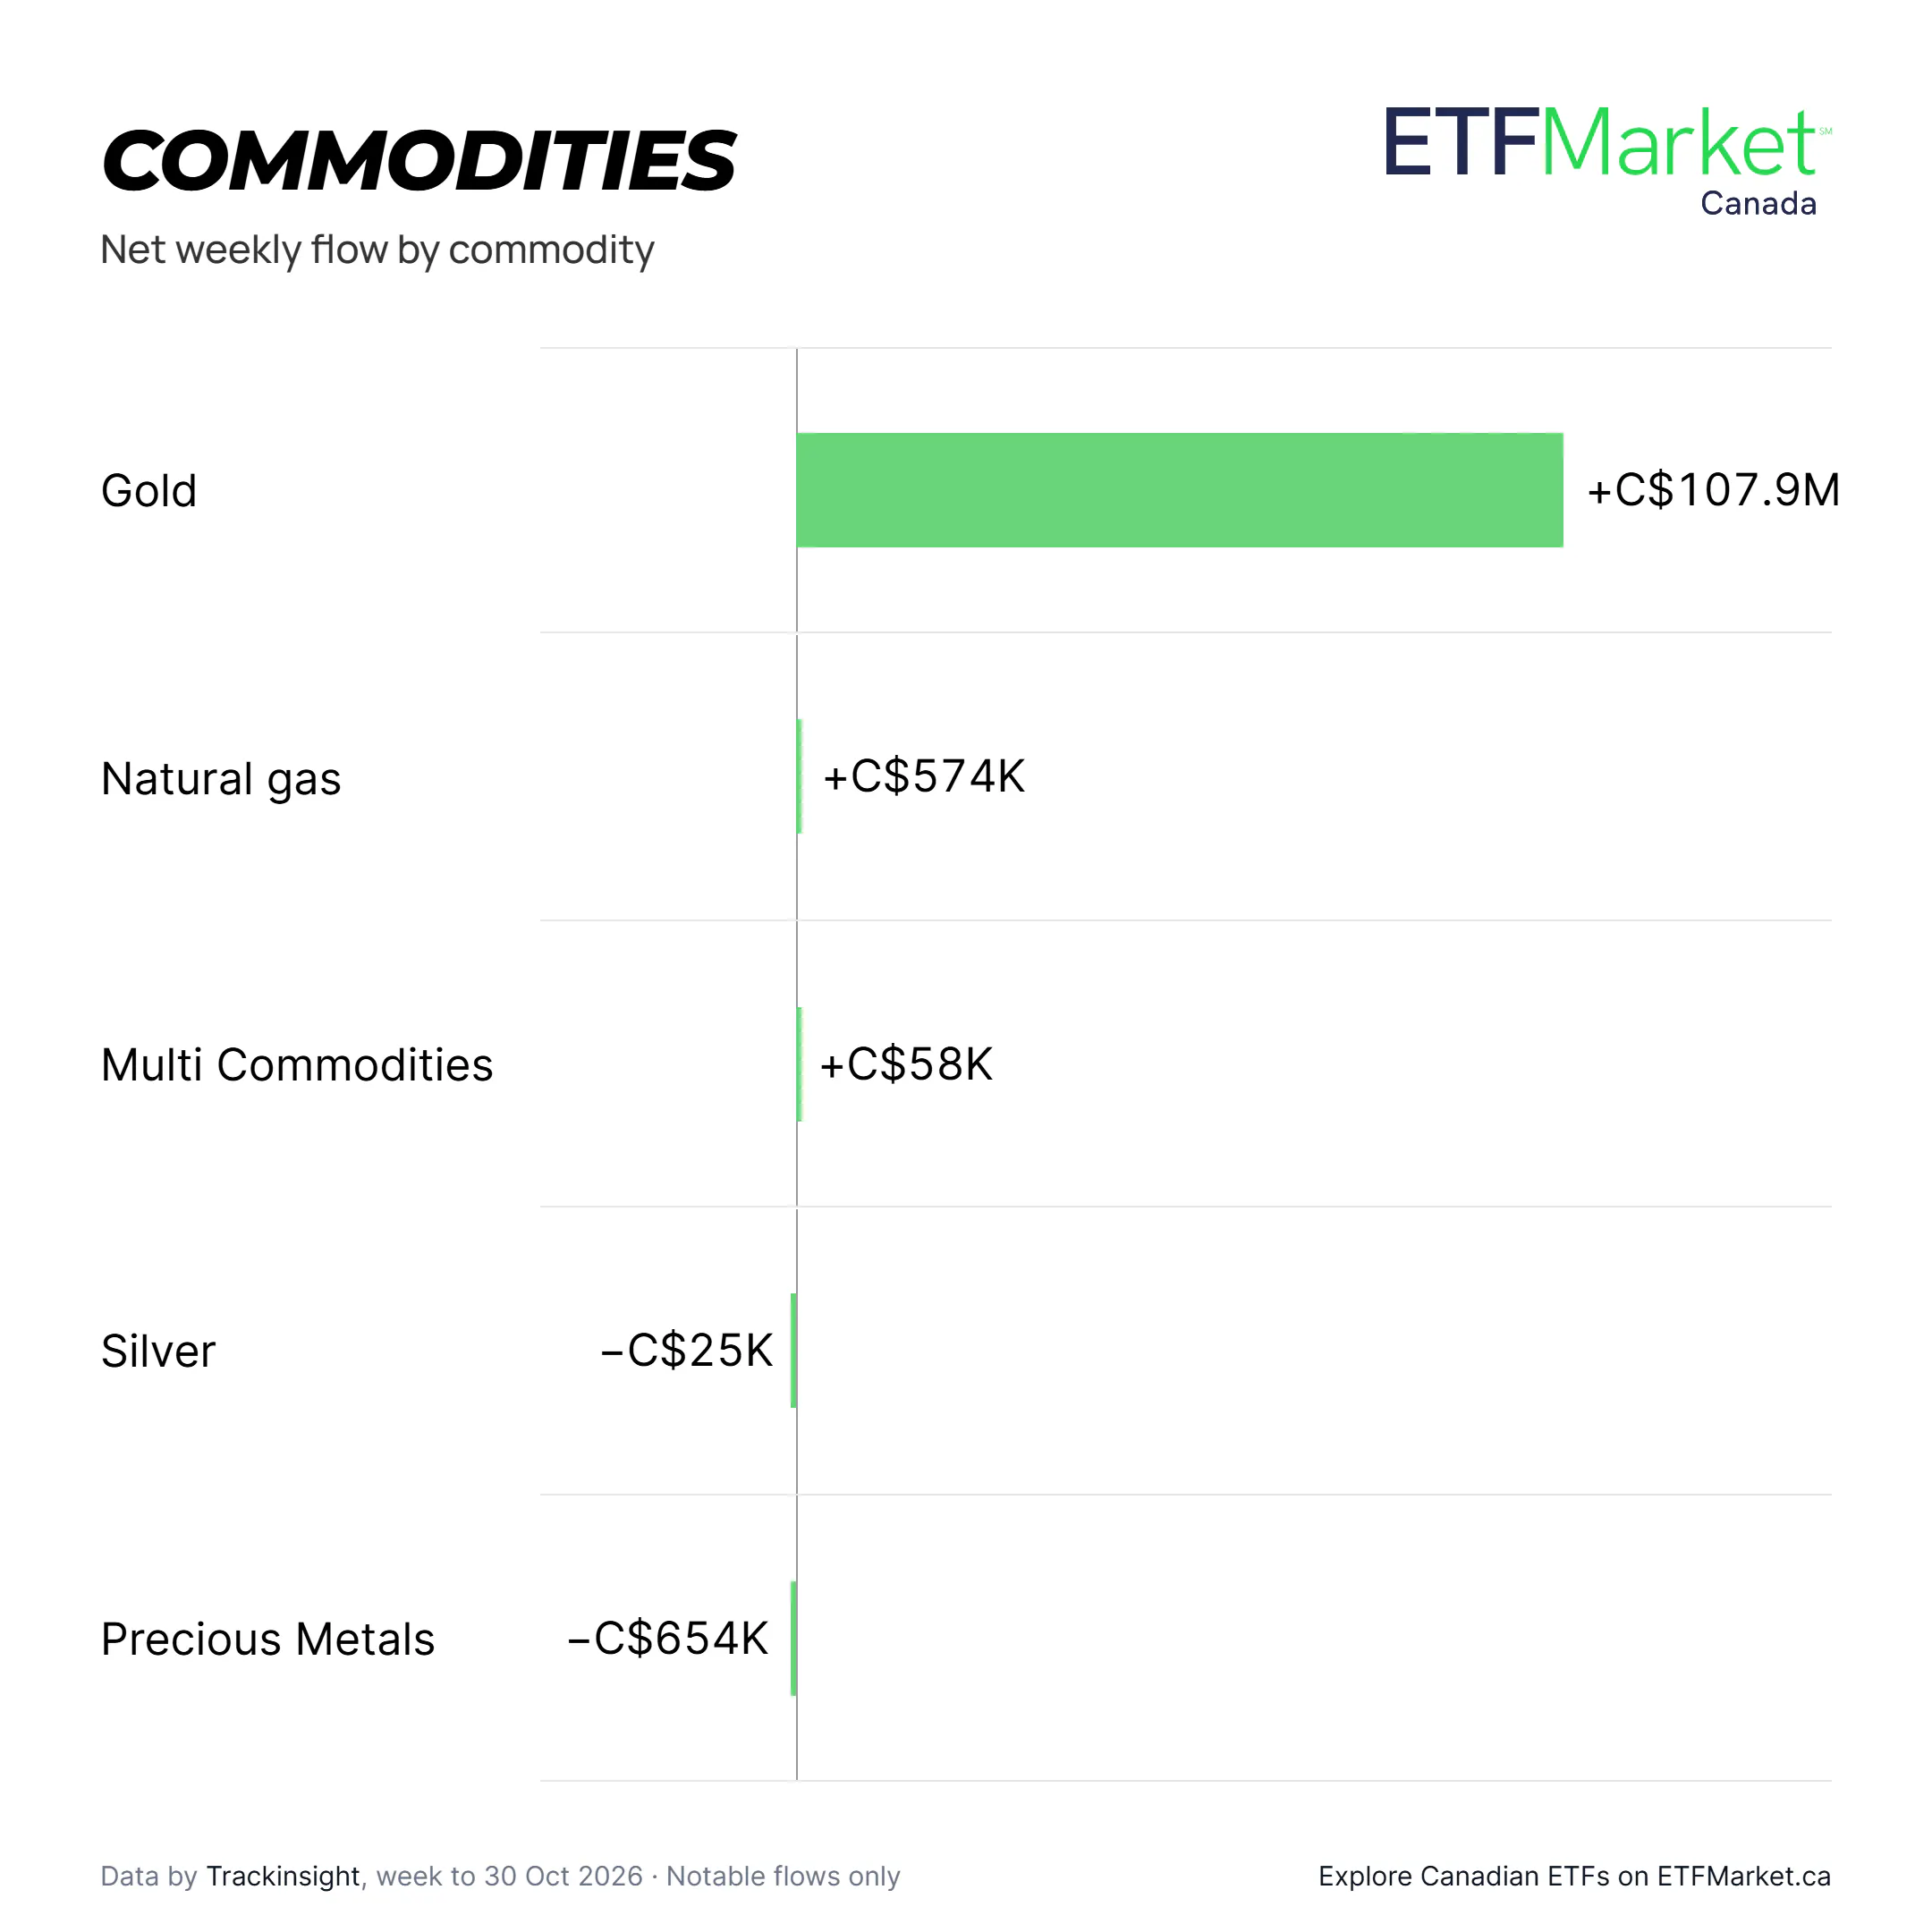
Gold attracted CA$107.9 million during the week.
Natural gas gathered CA$0.6 million and Multi Commodities attracted CA$58,442, while Precious Metals recorded CA$0.7 million in outflows, followed by Silver at CA$24,803.
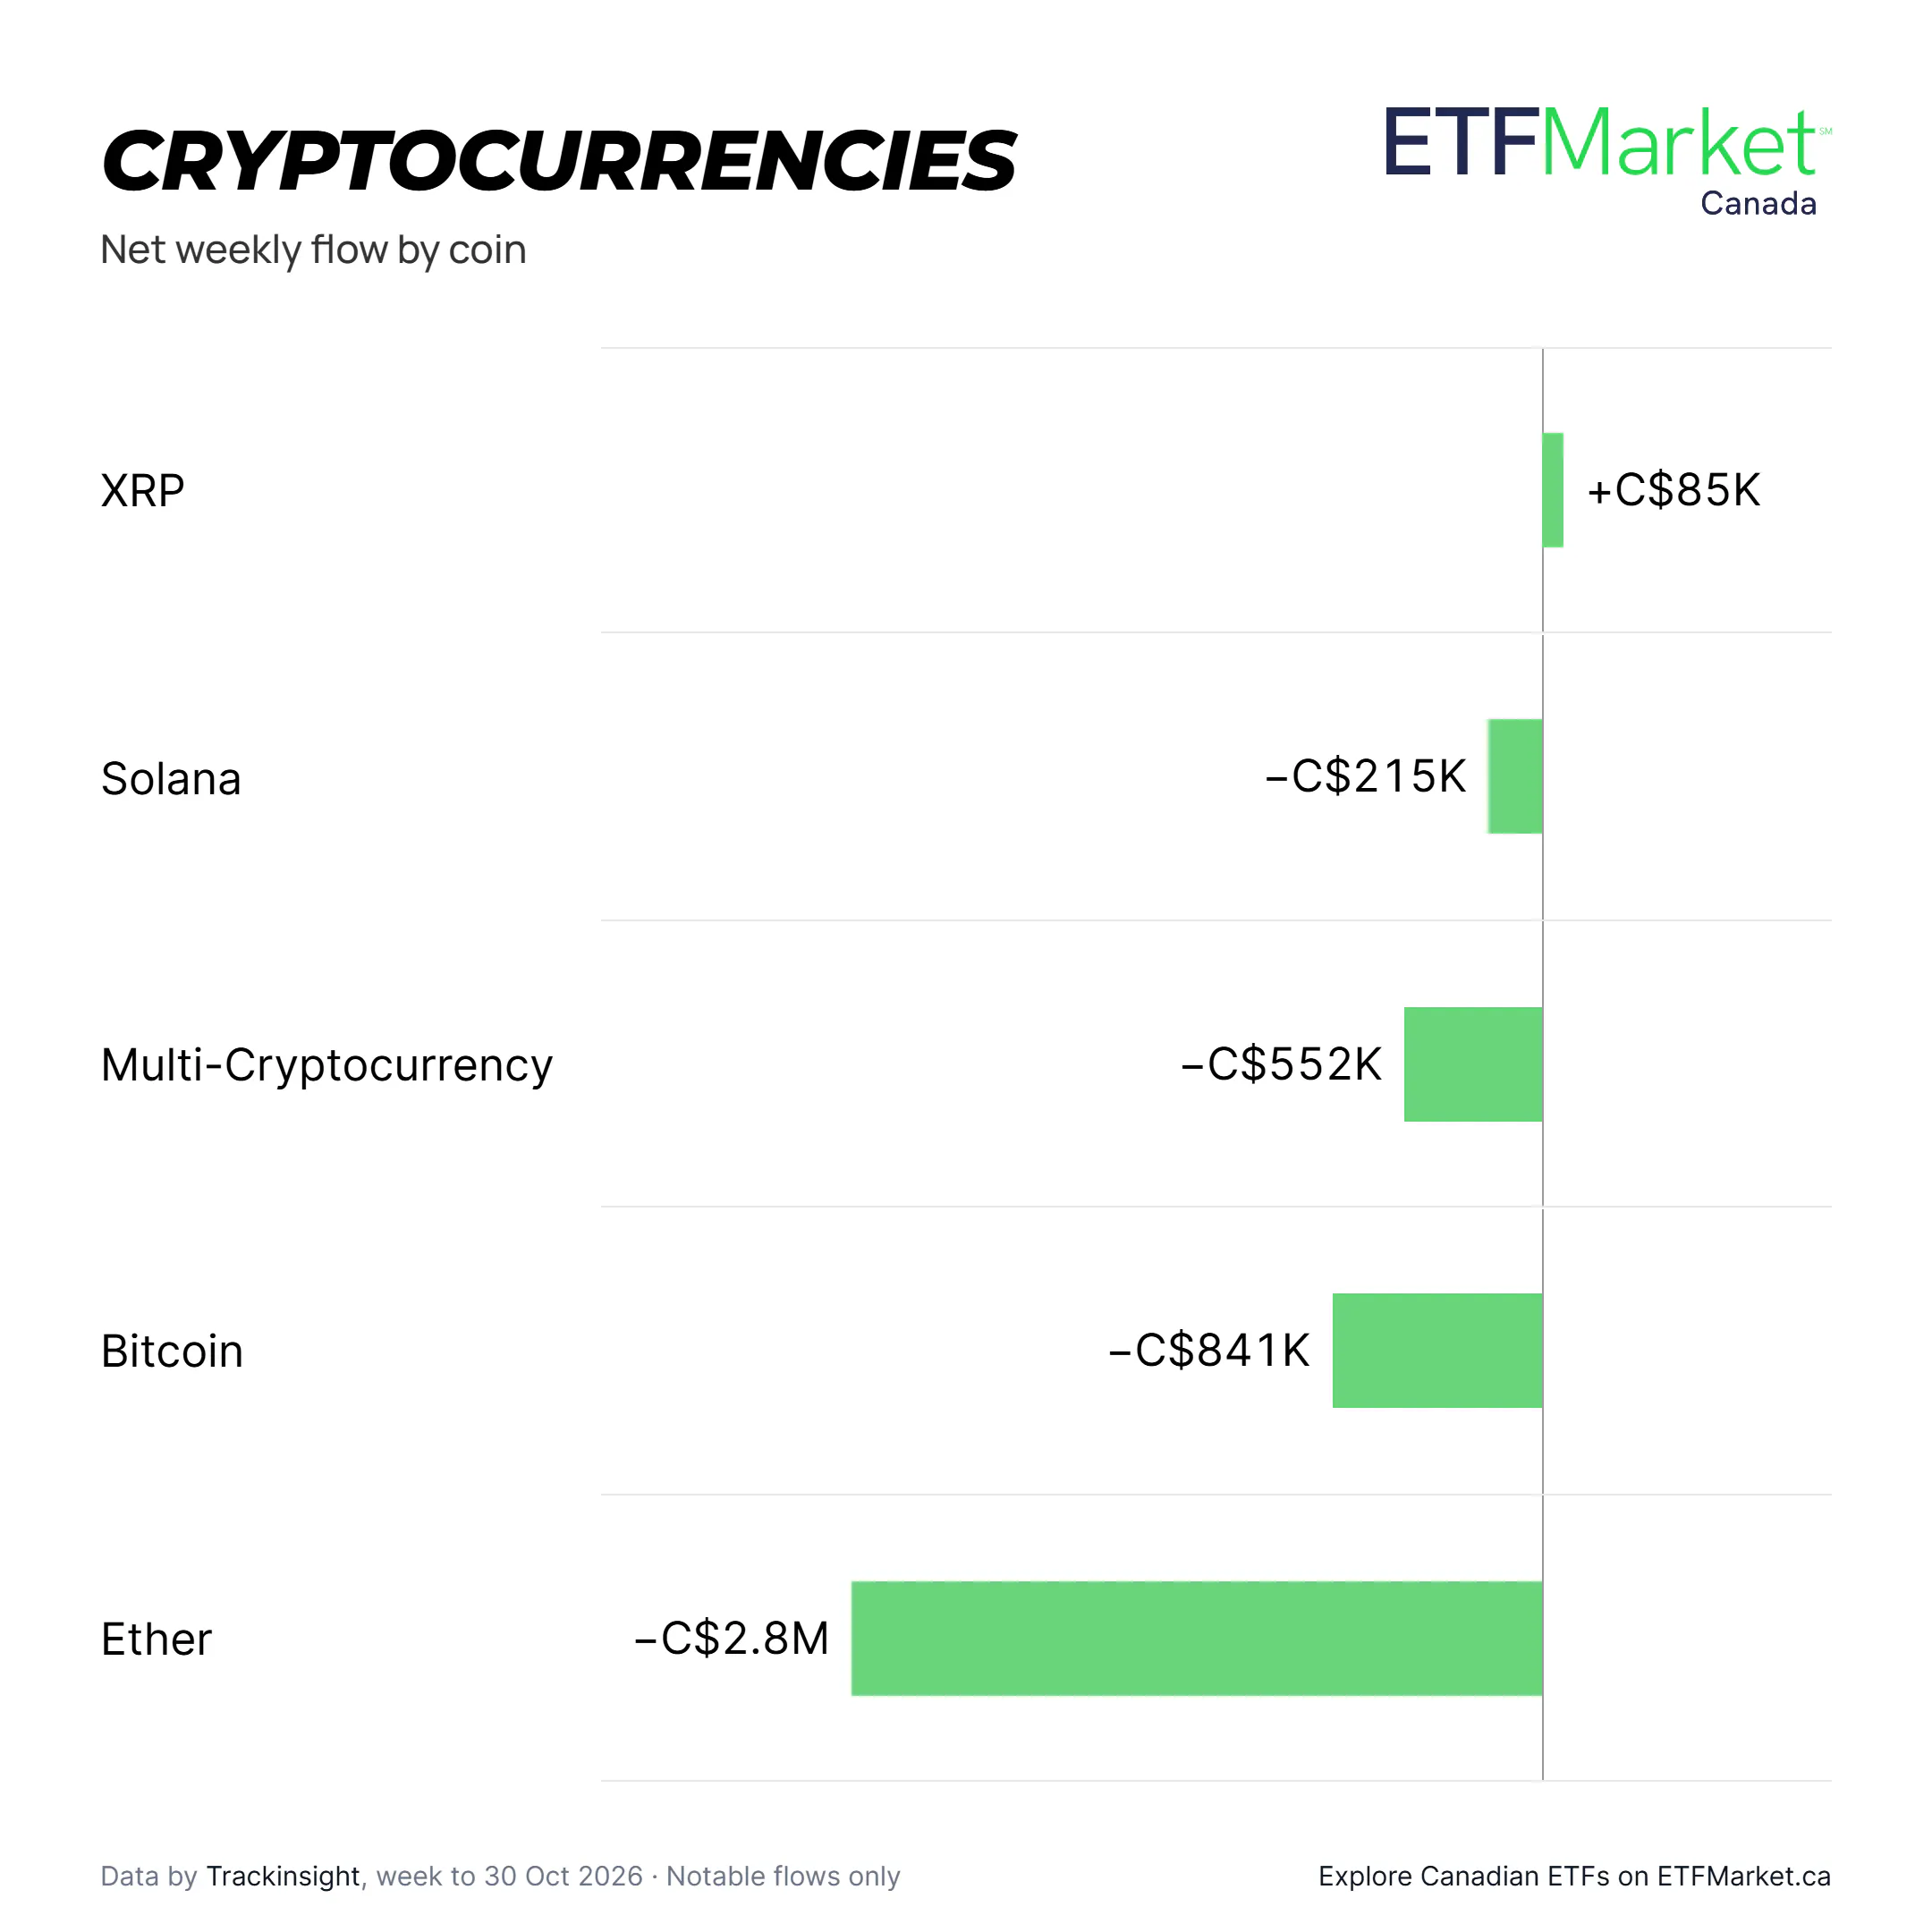
XRP Leads Cryptocurrency ETP Inflows While Ether Sees Largest Outflow
XRP products attracted CA$84,644, the largest cryptocurrency inflow of the week.
Ether recorded the largest outflow at CA$2.8 million, followed by Bitcoin at CA$0.8 million and Multi-Cryptocurrency at CA$0.6 million.
Top 10 ETF Issuers by Net Inflows This Week
- BMO: CA$1.27 billion
- Dynamic Funds: CA$640.6 million
- Fidelity: CA$552.7 million
- Vanguard: CA$552.7 million
- iShares: CA$366.8 million
- TD Asset Management: CA$237.7 million
- Desjardins Investments: CA$167.0 million
- CIBC: CA$87.2 million
- Mackenzie Investments: CA$76.1 million
- Manulife Investments: CA$70.7 million
Top 10 Most Popular ETFs by Net Inflows This Week
- BMO Equal Weight Banks Index ETF - CAD (ZEB): CA$717.3 million
- BMO S&P/TSX Capped Composite Index ETF - CAD (ZCN): CA$167.2 million
- Dynamic Active Bond ETF - CAD (DXBB): CA$147.4 million
- iShares Core MSCI EAFE IMI Index ETF - CAD (XEF): CA$137.1 million
- Dynamic Active Canadian Bond ETF - CAD (DXBC): CA$118.5 million
- Dynamic Active Tactical Bond ETF - Distributing - CAD (DXB): CA$118.5 million
- Vanguard S&P 500 Index ETF - CAD (VFV): CA$118.3 million
- Dynamic Active Crossover Bond ETF - Distributing - CAD (DXO): CA$113.7 million
- BMO Money Market Fund ETF - CAD (ZMMK): CA$108.6 million
- iShares Core S&P/TSX Capped Composite Index ETF - CAD (XIC): CA$103.1 million
Top 10 Performing Equity ETFs This Week
- iShares Genomics Immunology and Healthcare Index ETF - CAD (XDNA): 4.69%
- Global X U.S. Infrastructure Development Index ETF - USD (PAVE): 3.75%
- iShares U.S. Aerospace & Defense Index ETF - CAD (XAD): 3.47%
- Global X Artificial Intelligence Memory Index ETF - CAD (DRAM): 3.37%
- BMO Global Health Care Fund Active ETF Series - CAD (ZGHC): 3.34%
- First Trust AlphaDEX U.S. Industrials Sector Index ETF - CAD (FHG): 3.33%
- Global X Equal Weight Global Healthcare Index ETF - CAD (MEDX): 3.19%
- First Trust NYSE Arca Biotechnology ETF - CAD (FBT): 3.16%
- Global X Korea KOSPI 200 Index ETF - CAD (KORX): 3.14%
- CI Global Healthcare Leaders Index ETF - CAD (CHCL.B): 3.04%
This article was prepared on October 31st, 2026 using Trackinsight ETF data. It is for informational purposes only and does not constitute investment advice. Please consult a registered financial professional before making any investment decision.