Canada Weekly ETF Flows | November 9-13, 2026
A recap of Canadian ETF flows, performance and market activity for November 9-13, 2026.

According to data by Trackinsight, Canadian-listed equity ETFs attracted C$2.83 billion in net inflows during the week ending November 13, followed by multi-asset ETFs with C$278.2 million and commodity ETFs with C$14.8 million. Fixed income ETFs recorded the largest asset-class outflows at C$665.5 million, followed by cryptocurrency ETFs (C$68.5M), currency ETFs (C$27.3M), and volatility products (C$3.7M).
Technology Leads While Communication Services Sees Largest Outflows
Information Technology led sector ETF inflows with C$107.7 million, followed by Financials (C$71.5M), Materials (C$61.8M), Real Estate (C$31.5M), and Consumer Staples (C$14.2M). Communication Services recorded the largest sector outflow at C$480.3 million, followed by Energy (C$37.8M), Health Care (C$19.5M), and Utilities (C$16.6M).
Technology and Industrials Lead Gains
Information Technology led sector returns with a 4.17% gain, followed by Industrials (+3.98%), Energy (+3.94%), Health Care (+2.03%), and Financials (+1.72%). Materials was the weakest-performing sector, declining 5.31%, followed by Communication Services (-1.27%) and Real Estate (-0.36%).
U.S. Equities Lead While Canadian Exposure Records Outflows
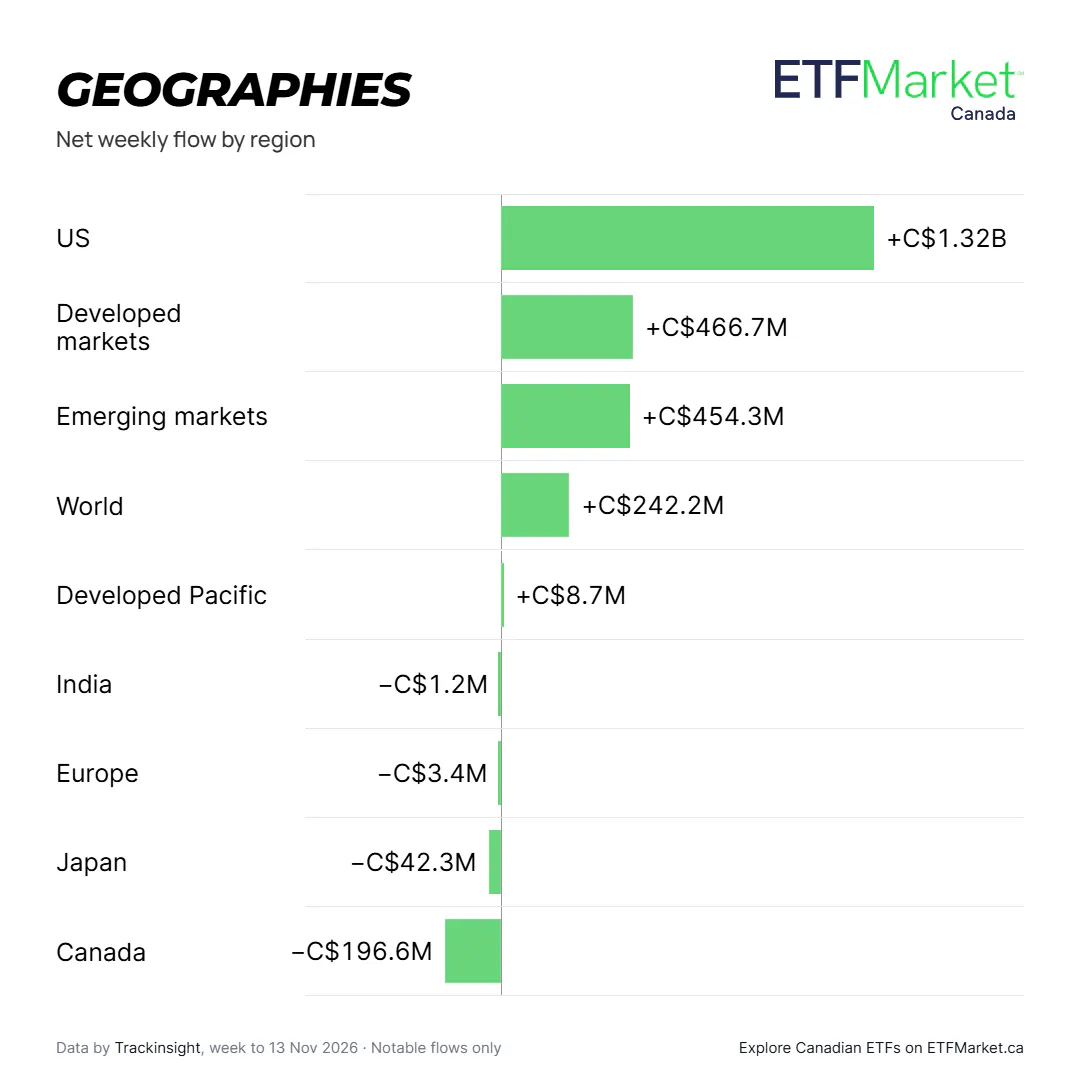
U.S.-focused equity ETFs attracted C$1.32 billion, followed by Developed markets (C$466.7M), Emerging markets (C$454.3M), and World (C$242.2M). Canada recorded the largest geographic outflow at C$196.6 million, followed by Japan (C$42.3M), Europe (C$3.4M), and India (C$1.2M).
Asia and South Korea Lead Weekly Returns
Asia topped geographic returns with a 9.00% gain, followed by South Korea (+8.15%), Japan (+5.72%), Developed Pacific (+5.30%), and Emerging markets (+3.86%). Greater China was the weakest geographic exposure, declining 6.42%, followed by China (-3.31%).
Global Infrastructure Leads Inflows
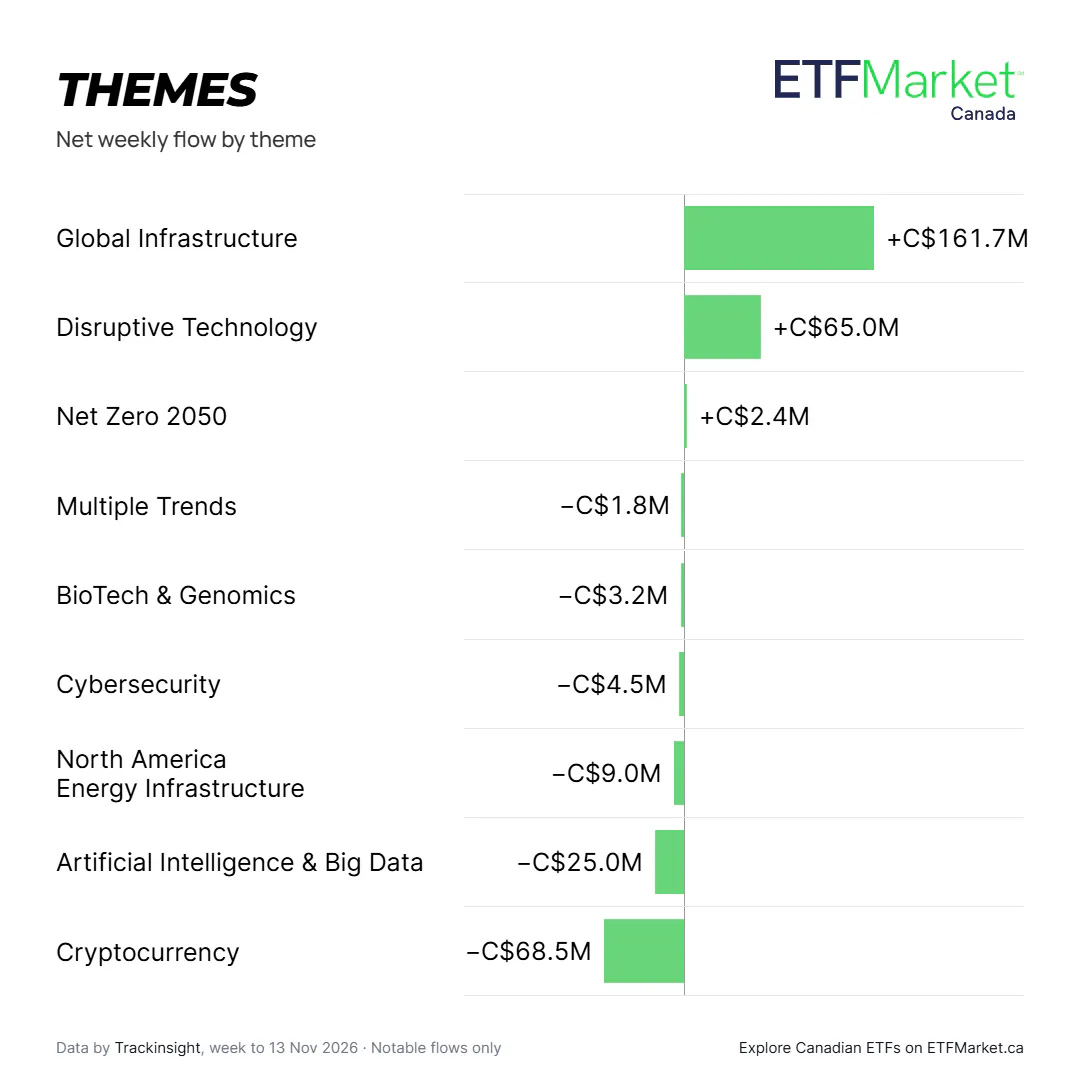
Global Infrastructure led thematic inflows with C$161.7 million, followed by Disruptive Technology (C$65.0M), Net Zero 2050 (C$2.4M), Electrification (C$1.5M), and Global Defense (C$1.2M). Cryptocurrency recorded the largest thematic outflow at C$68.5 million, followed by Artificial Intelligence & Big Data (C$25.0M), North America Energy Infrastructure (C$9.0M), Cybersecurity (C$4.6M), and BioTech & Genomics (C$3.2M).
Space and AI Lead Gains
Space led thematic performance, gaining 6.72%, followed by Artificial Intelligence & Big Data (+6.25%), Electrification (+4.98%), US Defense (+4.67%), and 5G (+4.38%). Cryptocurrency recorded the weakest thematic return at -9.17%, followed by China Disruptive Technology (-6.42%), BioTech & Genomics (-3.70%), Battery Value-Chain (-3.61%), and Cannabis & Psychedelics (-3.41%)..
Corporate Investment Grade Records Largest Outflows
Corporate Aggregate ETFs led fixed income inflows with C$54.8 million, followed by Government Investment Grade (C$41.8M), Government Agencies Investment Grade (C$10.6M), Municipal Investment Grade (C$7.6M), and Corporate High Yield (C$7.3M).
Corporate Investment Grade ETFs recorded the largest outflow at C$616.7 million, followed by Government Aggregate (C$55.8M), Aggregate Investment Grade (C$40.3M), and Aggregate High Yield (C$0.5M).
Gold Leads Weekly Inflows
Gold attracted C$12.1 million, followed by Multi Commodities (C$4.1M). Natural gas recorded the largest commodity outflow at C$1.2 million, followed by Precious Metals (C$1.0M). Crude Oil and Silver recorded negligible net flows during the week.
Ether and Bitcoin Lead Outflows
XRP led cryptocurrency product inflows with C$3.1 million, followed by Multi-Cryptocurrency products (C$781,600) and Solana (C$757,400). Ether recorded the largest cryptocurrency outflow at C$40.4 million, followed by Bitcoin (C$32.7M).
Top 10 Issuers by Weekly Net Inflows
- Vanguard: C$769.4M
- Fidelity: C$653.0M
- Scotia Bank: C$484.7M
- TD Asset Management: C$284.2M
- Dynamic Funds: C$275.4M
- Mackenzie Investments: C$162.8M
- iShares: C$155.3M
- BMO: C$152.2M
- Desjardins Investments: C$136.5M
- CIBC: C$128.2M
Top 10 Canadian ETFs by Weekly Inflows
- BMO MSCI Emerging Markets Index ETF (ZEM): C$264.0M
- iShares S&P/TSX 60 Index ETF (XIU): C$256.0M
- Scotia International Equity Index Tracker ETF (SITI): C$214.3M
- Scotia Canadian Large Cap Equity Index Tracker ETF (SITC): C$203.8M
- Mackenzie US Large Cap Equity Index ETF (QUU): C$202.8M
- Scotia US Equity Index Tracker ETF (SITU): C$196.1M
- Fidelity Global Equity+ Fund (FGEP): C$173.0M
- Mackenzie GQE International Equity ETF (MIQE): C$163.2M
- BMO S&P 500 Index ETF (ZSP): C$159.0M
- Dynamic Active Global Infrastructure ETF (DXN): C$151.4M
Top 10 Canadian ETFs by Weekly Performance
- Global X Artificial Intelligence Memory Index ETF (DRAM): +11.74%
- iShares Semiconductor Index ETF (XCHP): +10.50%
- iShares A.I. Innovation and Tech ETF (XBAI): +9.72%
- Global X Asia Semiconductor Index ETF (ACHP): +9.00%
- TD Global Technology Innovators Index ETF (TECI): +8.57%
- Global X Korea KOSPI 200 Index ETF (KORX): +8.15%
- iShares MSCI USA Momentum Factor Index ETF (XMTM): +7.71%
- Global X Artificial Intelligence Semiconductor Index ETF (CHPS): +7.31%
- CI Morningstar Global Next Gen AI Index ETF (INAI): +7.26%
- Global X Space Tech Index ETF (ORBX): +6.72%
This article was prepared on November 16th, 2026 using Trackinsight ETF data. It is for informational purposes only and does not constitute investment advice. Please consult a registered financial professional before making any investment decision.