Canadian ETF Comparison: FCGC vs. RNAV
Fidelity leans into industrials and can invest further abroad, while RBC favours financials and combines lower fees with stronger three-year returns.

Active management has become a significant part of the Canadian ETF ecosystem, with CA$336 billion in assets at the end of September and 37% of total ETF inflows through the first nine months of 2026.FCGC
In an increasingly volatile and unpredictable market, active managers can look for overlooked opportunities while adjusting holdings to manage risk as conditions change.
Their flexibility allows them to be selective about both the companies they own and the risks they take.
For investors seeking an active approach to Canadian equities, the Fidelity Greater Canada Fund (FCGC) and the RBC North American Value Fund (RNAV) share a focus on long-term capital growth, but differ in where they invest, what they charge and how they have performed.
Using Cboe Canada’s ETF Market Comparison tool and the issuers’ portfolio disclosures, we explore their investment approaches, holdings, fees and performance.
FCGC and RNAV Share a Canadian Focus
Both funds belong to the Canadian Focused Equity category defined by the Canadian Investment Funds Standards Committee (CIFSC). The category requires at least 50%, but less than 90%, of equity holdings to be invested in securities domiciled in Canada, leaving room for foreign stocks.
Both managers use fundamental analysis and bottom-up stock selection to find out-of-favour businesses with long-term growth potential. Fidelity can look internationally for those opportunities, while RBC’s prospectus restricts its foreign exposure to the United States.
FCGC vs. RNAV: Portfolio and Sector Allocations
As of August 31, 2026, Fidelity allocated 54.3% to Canada and 36.6% to the U.S., with smaller positions in the United Kingdom (4.5%), Sweden (1.1%) and other countries (1.3%). Cash and net other assets accounted for 2.2%.
RBC held 53.2% in Canada and 33.8% in the U.S., with 10.0% in fixed income or cash and the remainder classified as “Diversified Countries.”
Fidelity favoured industrials at 24.6%, followed by financials at 17.8% and materials at 14.8%.
RBC leaned more heavily into financials, which represented 29.9% of its equity allocation, followed by materials at 12.3% and industrials at 9.9%. Both reported 11.8% in technology and roughly 10% in energy.
Fidelity’s industrials exposure was reflected in major holdings such as Teledyne Technologies, Westinghouse Air Brake Technologies, Canadian Pacific Kansas City and Canadian National Railway.
As of June 30, 2026, the fund held 98 positions, with its top ten representing 30.0% of assets.
RBC’s top ten accounted for 25.7% of assets as of August 31, 2026.
Royal Bank of Canada (4.4%), Toronto-Dominion Bank (3.2%) and the iShares S&P/TSX Global Gold Index ETF (3.0%) led the portfolio. Amazon, Shopify, Canadian Natural Resources, JPMorgan Chase, Microsoft, Bank of Montreal and NVIDIA rounded out the list.
FCGC vs. RNAV: Size, Costs and Flows
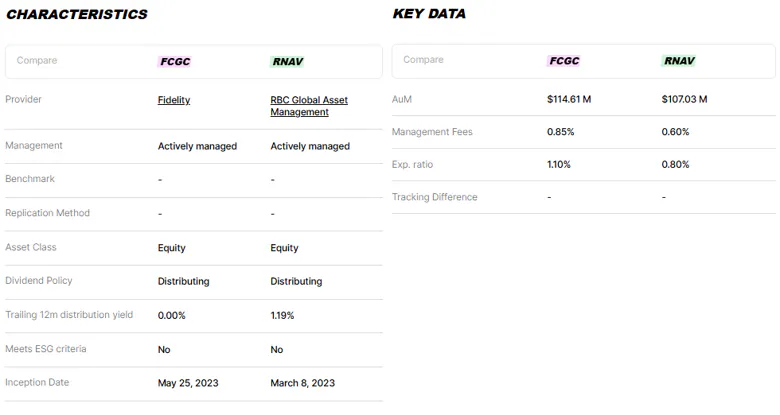
FCGC and RNAV are similar in size, with approximately $114.6 million and $107.0 million in assets, respectively.
Both remain small compared with established flagship Canadian equity funds, but a smaller asset base alone is no reason to rule them out.
RNAV charges a 0.60% management fee versus FCGC’s 0.85%. Its expense ratio is also lower at 0.80%, compared with 1.10% for Fidelity.
RBC has attracted more money recently.
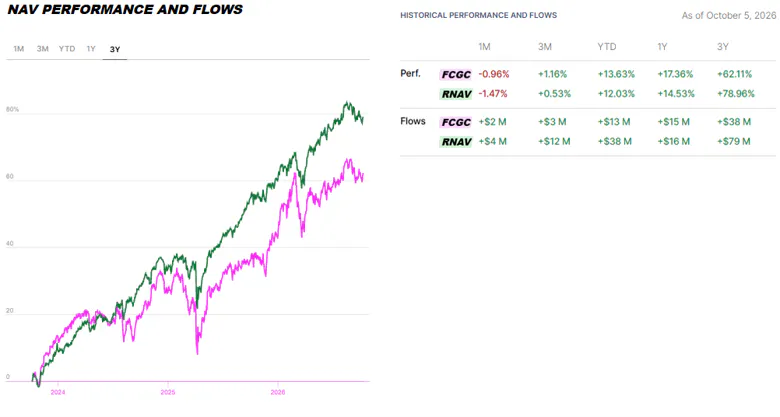
As of October 5, 2026, RNAV had gathered $38 million in year-to-date net inflows, compared with $13 million for FCGC. Over three years, RNAV attracted $79 million against Fidelity’s $38 million.
FCGC vs. RNAV: Which ETF Performed Better?
RNAV delivered a cumulative three-year return of 79%, ahead of FCGC’s 62%, as of October 5, 2026.
Fidelity led over the more recent periods, returning 17.4% over one year versus RBC’s 14.5%, and 13.6% year to date versus 12%. Both declined over the latest month, with FCGC losing 0.96% and RNAV falling 1.5%.
Both experienced sharp setbacks in 2025 and early 2026, although RNAV’s drawdowns appear shallower in the chart.
Final Takeaway
RNAV pairs lower fees with stronger three-year returns, while FCGC has led over the past year and offers more freedom to invest beyond North America.
Their portfolios also favour different sectors: financials for RBC and industrials for Fidelity. The choice therefore depends on the exposure investors want, alongside how much they value lower costs versus broader investment flexibility.
Portfolio allocations are dated August 31, 2026. Fidelity’s holdings and concentration figures are dated June 30, 2026; RBC’s are dated August 31, 2026.
This article was written on October 5, 2026. It is for information purposes only and does not constitute investment advice. Seek advice from a registered financial professional before making any investment decision.