Dividend Investing - Why Going Global and Focusing on Quality Makes Sense
Dividend strategies tend to be favoured among Canadian investors for a variety of reasons. Some enjoy the feeling of seeing a periodic distribution hit their account every quarter or month. Others rely on dividend-paying equities to fund retirement or passive income needs. A few overweight domestic Canadian dividend equities to take advantage of greater tax-efficiency.

Dividend strategies tend to be favoured among Canadian investors for a variety of reasons. Some enjoy the feeling of seeing a periodic distribution hit their account every quarter or month. Others rely on dividend-paying equities to fund retirement or passive income needs. A few overweight domestic Canadian dividend equities to take advantage of greater tax-efficiency.
That being said, dividend investing doesn't have to be restricted to the same handful of blue-chip stocks listed on the TSX. While these stocks may provide higher-than-average yields, they can be subject to numerous risks, including geographical, industry, sector, and style-specific ones. Here, we consider the benefits of a globally diversified approach for dividend investors and the importance of the quality factor as a driver of equity return.
Why diversify your dividends around the world?
Many Canadians overweight domestic equities in their portfolio, which is called a "home-country bias".[1] And while a home-country bias can be advantageous – with such potential benefits as lower currency risk, better tax-efficiency, and lower portfolio volatility – this is only true to a certain degree. A heavy home-country bias can also expose Canadian investors to numerous additional risks.
Looking at the MSCI World Index, we see that as of February 28, 2023, Canadian equities hold a 3.44% allocation by market cap weight[2]. Moreover, if we examine the composition of Canada's benchmark S&P/TSX Composite Index, we see heavy allocations to financial (31.7%) and energy (17.2%) sector equities[3].
The takeaway is that an excessive Canadian home-country bias exposes investors to geographical and sector-specific risks. This is more concerning when you consider that the popular S&P/TSX Composite High Dividend Index has an even greater concentration in financial and energy at 31.1% and 29.7% respectively[4].
Sector concentration aside, it's important to also note that winners rotate over time, especially when it comes to geography. Consider the performance of some popular Canadian, U.S, international, and emerging market indexes over the last two decades – each one outperformed and underperformed for extended periods of time.
Annual Asset Class Index returns (in Canadian dollars), ranked from best to worst performers in any given year
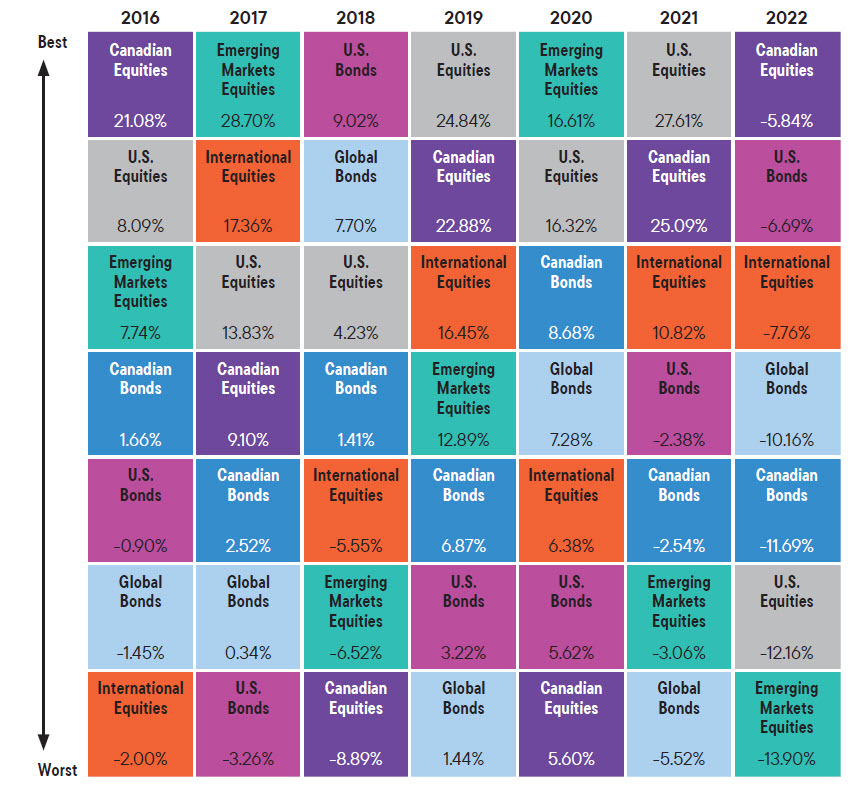
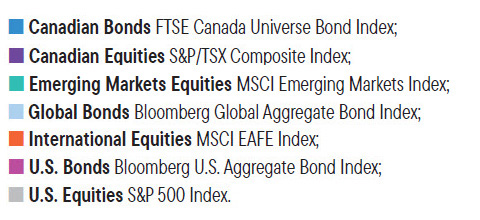
Source: Morningstar Research Inc., December 31, 2022.
Rather than trying to pick the winners of the last decade, it makes sense to consider a more diversified investment portfolio. This is exactly the approach that the Franklin Global Dividend Quality Index ETF (FLGD) takes – its underlying index, the LibertyQ Global Dividend Index encompasses 100 North American, international developed, and emerging market equities.
Why high yields alone aren't enough
Another issue with some existing dividend equity funds that only track Canadian equities is a myopic focus on yields. This potentially leads to the inclusion of "yield traps" – companies with high dividends, but unsustainable pay-out ratios and weak profitability.
A high dividend is never guaranteed, and projections of prospective yields based on recent payouts can fail at a minute’s notice. Companies can, and have, cut dividends during times of market crisis. A strategy that focuses solely on high dividend yields is akin to driving using the rear-view mirror and will likely fall short when the road gets bumpy.
In contrast, the LibertyQ Global Dividend Index tracked by FLGD implements a rigorous set of screeners to avoid this problem. Stocks with a negative year-over-year Dividend per Share (DPS) growth in any of the last five years, or a five-year average monthly dividend less than 1.2x the five-year average monthly dividend yield of the MSCI AC World ex-REITS Index, are excluded.[5]
In addition, the LibertyQ Global Dividend Index possesses much higher return on asset (ROA) and return on equity (ROE) metrics compared to the MSCI AC World ex-REITS Index, standing at 11.32 versus 9.75, and 27.44 versus 20.02 respectively as of March 10, 2023.[6]
The importance of quality dividend stocks
Another consideration for dividend investors is to target additional equity style factors outside of yield. One popular factor is "quality", but targeting this factor isn't always straightforward given the multiple ways it can be defined, measured, and captured.
Altogether, the combination of both a dividend and quality factor screen results in a portfolio of equities with robust potential profitability. The LibertyQ Global Dividend Index aims to effectively capture a basket of large-cap equities with a stable history of dividend payments and quality fundamentals.
This fundamental-weighted process pursues better exposure to quality factors and reduces concentration in a handful of high-yielding equities, compared to a market cap-weighted approach. In addition, the rules-based nature of FLGD's index helps keep expense ratios relatively low at 0.37%, and portfolio turnover minimal.
With a four-star Morningstar rating based on its five-year trailing returns out of a universe of 1,344 peer funds in the Global Equity category[7], FLGD offers a compelling alternative to Canadian investors seeking affordable exposure to quality global dividend equities with high and persistent dividend income.
Important legal information
Commissions, trailing commissions, management fees, brokerage fees and expenses may be associated with investments in mutual funds and ETFs. Please read the prospectus and fund fact/ETF facts document before investing. ETFs trade like stocks, fluctuate in market value and may trade at prices above or below the ETF’s net asset value. Brokerage commissions and ETF expenses will reduce returns. Performance of an ETF may vary significantly from the performance of an index, as a result of transaction costs, expenses, and other factors. Indicated rates of return are historical annual compounded total returns for the period indicated, including changes in unit value and reinvestment distributions, and do not take into account any charges or income taxes payable by any security holder that would have reduced returns. Mutual funds and ETFs are not guaranteed. Their values change frequently. Past performance may not be repeated.
ETF units may be bought or sold throughout the day at their market price on the exchange on which they are listed. However, there can be no guarantee that an active trading market for ETF units will develop or be maintained, or that their listing will continue or remain unchanged. While the units of ETFs are tradable on secondary markets, they may not readily trade in all market conditions and may trade at significant discounts in periods of market stress.
Foreign Investment Risk. The value of foreign securities may be influenced by the policies of foreign governments and by political, economic or social instability. There may be less information about foreign companies than North American firms and there may be lower standards of government supervision and regulation in foreign financial markets. The legal systems of some foreign countries may not adequately protect Unitholders’ rights. Some or all of these factors could make a foreign investment more or less volatile than a North American investment. If a Franklin ETF or the underlying fund in which a Franklin ETF invests holds these securities, the Franklin ETF may have difficulty enforcing legal rights in jurisdictions outside Canada.
[1] Source: Investor Economics as of 31/12/2018
[2] Source: MSCI; as of 28/02/2023
[3] Source: S&P Global; as of 28/02/2023
[4] Source: S&P Global; as of 28/02/2023
[5] Source: MSCI; as of 28/02/2023
[6] Source: MSCI; as of 28/02/2023
[7] ©2023 Morningstar, Inc. All rights reserved. As of 02/28/2023. The information contained herein: (1) is proprietary to Morningstar and/or its content providers; (2) may not be copied or distributed and (3) is not warranted to be accurate, complete or timely. Neither Morningstar nor its content providers are responsible for any damages or losses arising from any use of this information.
The Morningstar Rating™ for funds, or “star rating”, is calculated for managed products with at least a three-year history, and subject to change monthly. Exchange-traded funds and open-ended mutual funds are considered a single population for comparative purposes. It is calculated based on a Morningstar Risk Adjusted Return measure that accounts for variation in a managed product’s monthly excess performance, placing more emphasis on downward variations and rewarding consistent performance. The top 10% of products in each product category receive 5 stars, the next 22.5% receive 4 stars, the next 35% receive 3 stars, the next 22.5% receive 2 stars, and the bottom 10% receive 1 star. The Overall Morningstar Rating is derived from a weighted average of the performance figures associated with its three-, five-, and 10-year (if applicable) Morningstar Rating metrics. The weights are: 100% three-year rating for 36-59 months of total return, 60% five-year rating/40% three-year rating for 60-119 months of total returns, and 50% 10-year rating/30% five-year rating/20% three-year rating for 120 or more months of total return. While the 10-year overall star rating formula seems to give the most weight to the 10-year period, the most recent three-year period actually has the greatest impact because it is included in all three rating periods. Ratings do not take into account the effects of sales charges and loads. Morningstar Rating is for the specified share class(es) only; other classes may have different performance characteristics.